Data Visualization and the Power of Video Walls: Turning Data Into Impact
In a world overwhelmed by data, the real value lies not in how much we collect but how clearly we communicate it. This is where data visualization takes center stage. And when that visualization is extended onto massive video walls, the impact becomes truly unforgettable.
Whether it’s a control room, corporate lobby, or immersive exhibit, video walls are transforming how we see data literally.
What Is Data Visualization?
Data visualization is the graphical representation of information and data. By using charts, graphs, maps, and animations, raw numbers are transformed into insights we can see, compare, and understand quickly.
It answers questions like:
- Where are the trends?
- What’s working?
- Where do we need attention?
The goal? Clarity. Speed. Action.
Why Video Walls?
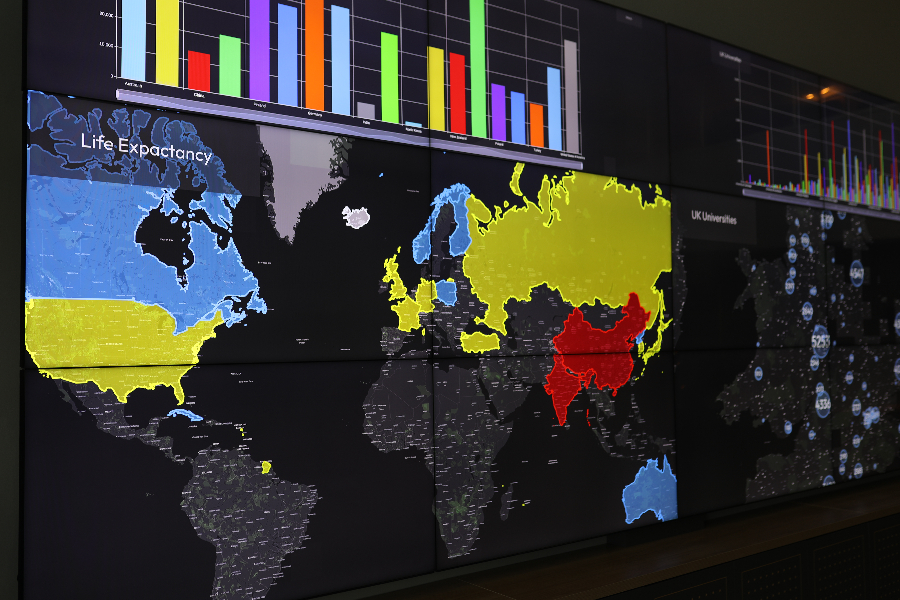
A screen wall (also called a video wall or digital wall) is a large display surface made up of multiple screens tiled together. These setups allow teams to view complex or high-volume data in real time across wide spaces.
Imagine:
- A crisis center monitoring live global events on a 12-screen-wide display
- A smart city control room tracking transportation, weather, and energy systems
- A financial firm visualizing live markets, news feeds, and analytics dashboards
These aren’t futuristic ideas they’re real, and growing fast. Data analytics on video walls is a strong asset for many operations.
How Data Visualization Meets Video Walls
Combining video walls with real-time data visualizations creates a high performance decision-making environment. It allows teams to:
1. See More, Instantly
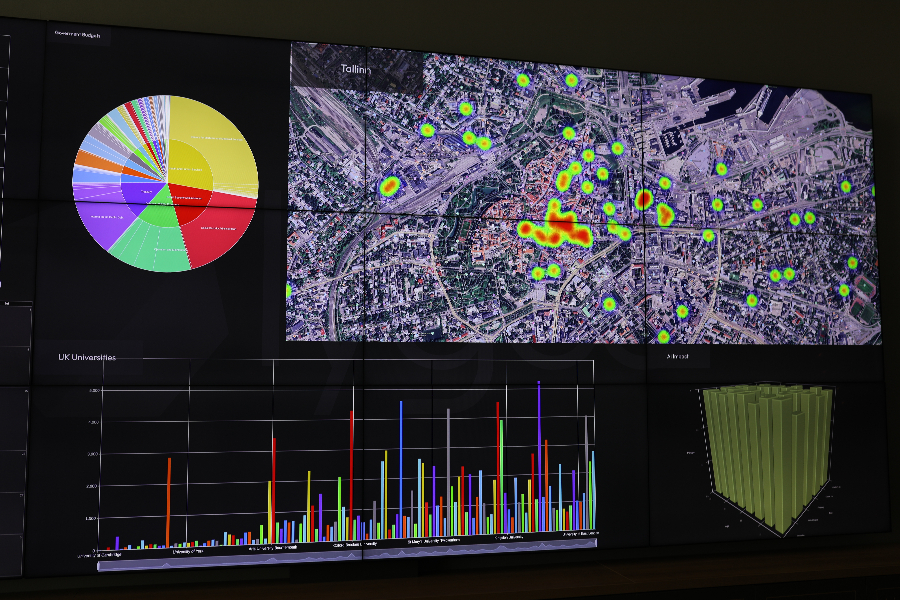
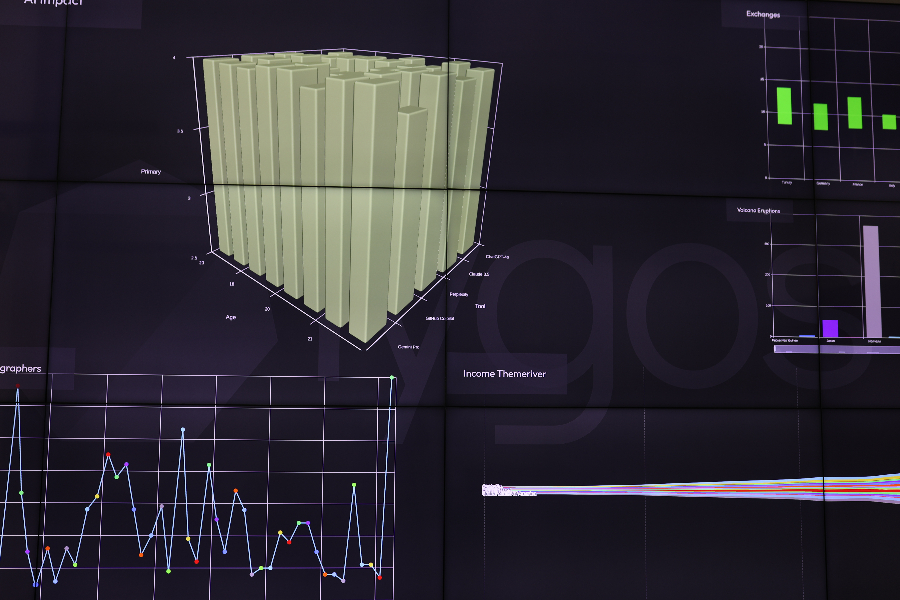
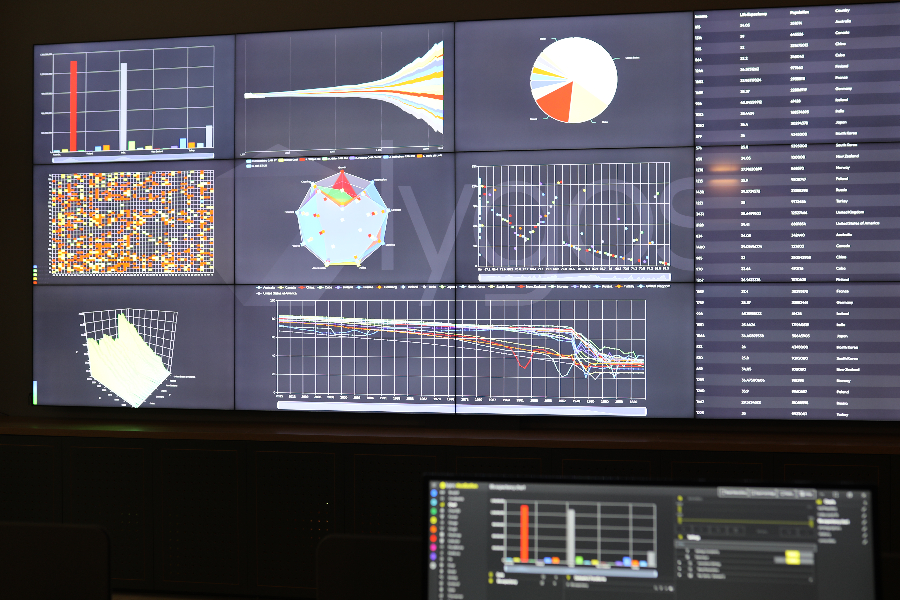
With massive surface areas and high resolutions, video walls display multiple dashboards or detailed data analytics side by side. No switching tabs. No scaling down. Just visibility.
2. Collaborate in Real Time
When all team members share the same visual context, decision making becomes faster and more unified. Visual data on screen walls drives alignment, urgency, and action.
3. Spot Trends & Anomalies Faster
Interactive heatmaps, graphs, or even AI-powered alerts can appear directly on the video wall making it easier to detect patterns or red flags before they escalate.
4. Create Visual Storytelling
For customer demos, boardrooms, or public-facing lobbies, video walls serve as stunning canvases. With smooth animations, transitions, and timelines, you can tell data stories that resonate and impress.
Real-World Use Cases
Here are some of the most exciting ways organizations are using data visualization on video walls today:
- Command Centers: Airports, military ops, and smart city centers monitor thousands of data points, weather, traffic, sensors on live dashboards.
- Corporate Data Hubs: Enterprises track KPIs, CRM data, and cloud operations across multiple locations.
- Retail & Advertising: Real-time sales performance, foot traffic, and customer behaviour visualized for in-store optimization.
- Healthcare Systems: Patient vitals, ER triage data, and supply chain logistics visualized across hospital walls.
Choosing the Right Tools
To build your own video wall visualization environment, consider:
- Data Sources: APIs, IoT devices, internal databases, or live feeds
- Visualization Platforms: Tools like Power BI, Tableau, Grafana, or custom solutions
- Display Software: Middleware that manages multi-screen layouts and synchronization (such as Lygos or similar)
- Hardware Setup: High-resolution screens, reliable GPUs, and scalable network infrastructure
Final Thoughts: The Visual Advantage
In our age of big data, it’s not enough to just store and sort. You need to see the story behind the numbers. And the bigger your canvas, the bolder your insights.
With data visualization on video walls, you empower your team with the clarity, speed, and presence to make better decisions together, in real time.