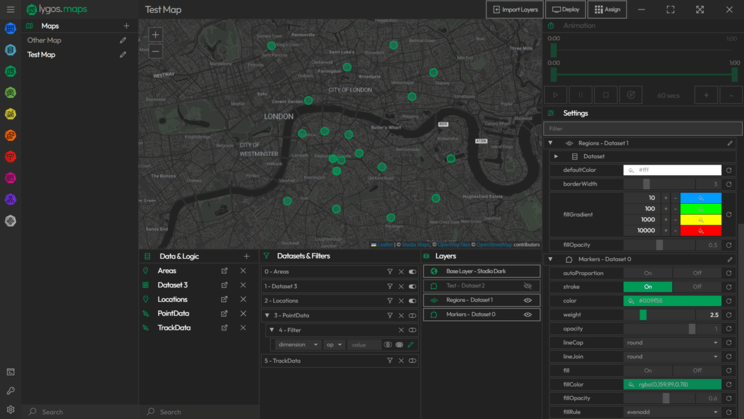
Create Multi-Layer Real-Time Interactive Maps from Multiple Data Sources for Video Walls and Dashboards. Create and Configure Filters. Add Data and Filters as Layers. Configure Visual Styles for those Layers. Animate Series Data over Time.
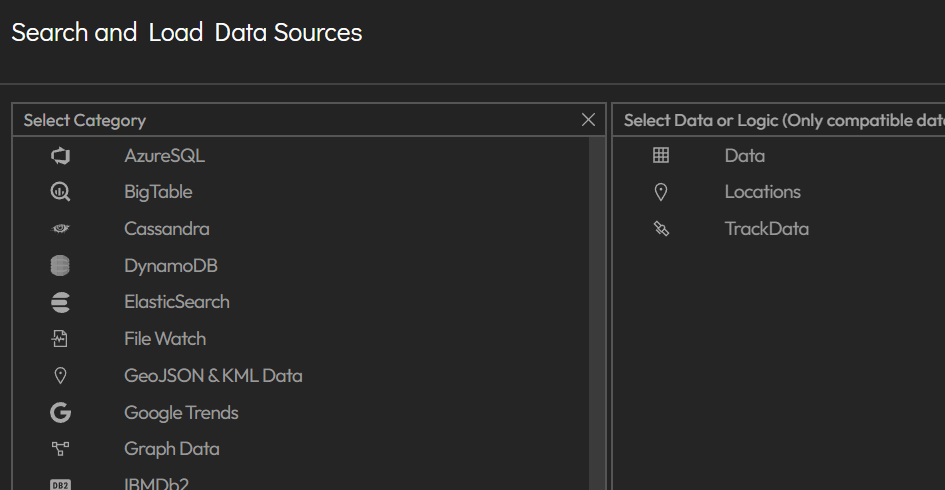
Multiple Data Sources
Load Data from Data Sources which has Geographical Data Format.
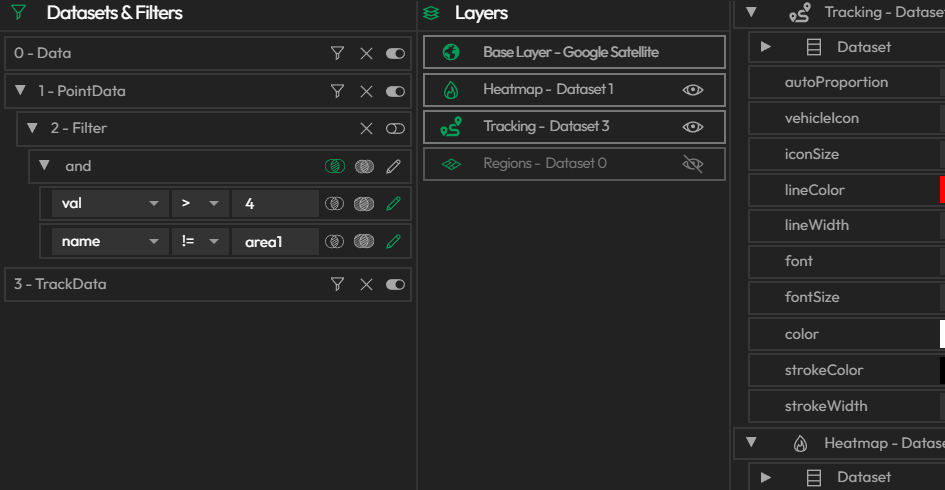
Filters & Layers
Create Filters by using Combination of And, Or & Expressions. Create Layers from Data or Filters of Data. Order Layers and Set their Visibility.
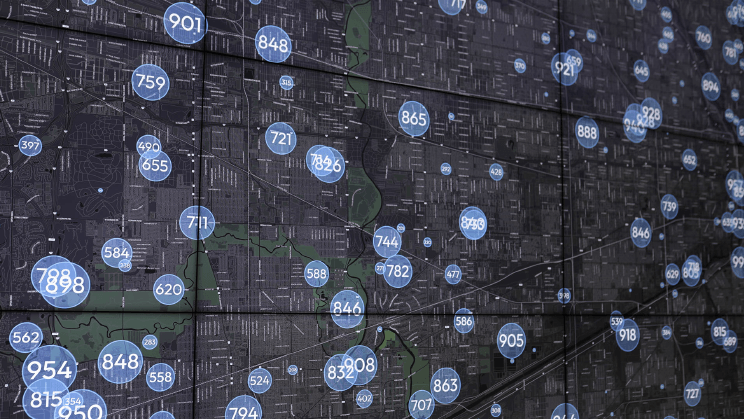
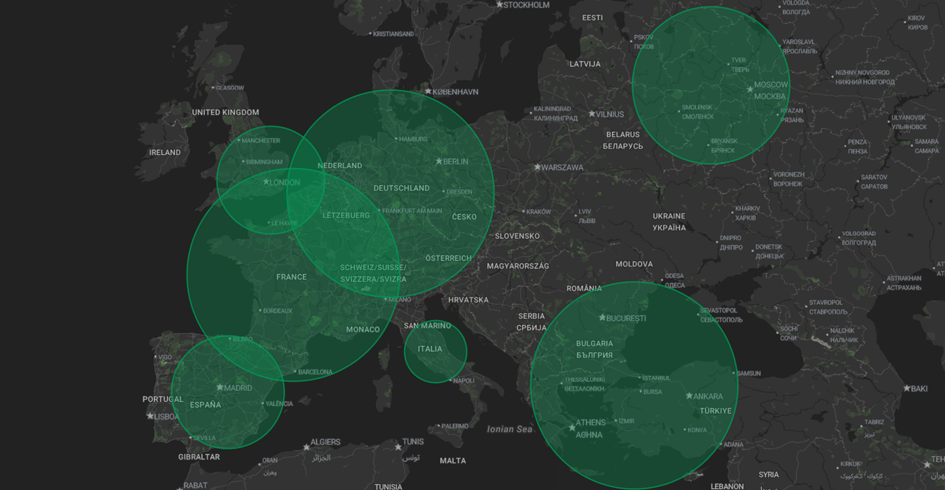
Marker Layer
Display data as Circle or Rectangle Markers with values and value dependent size.
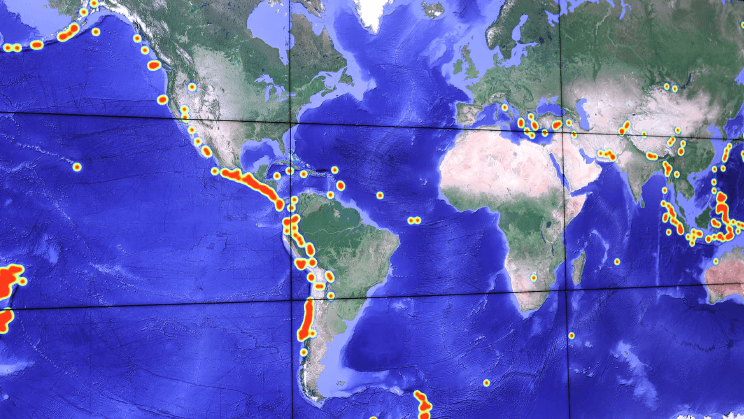
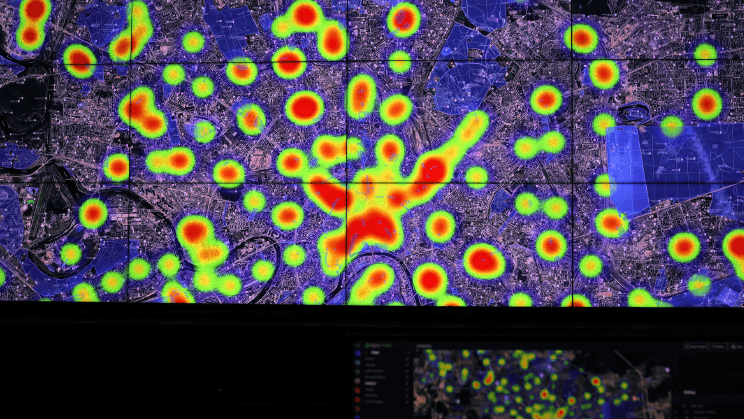
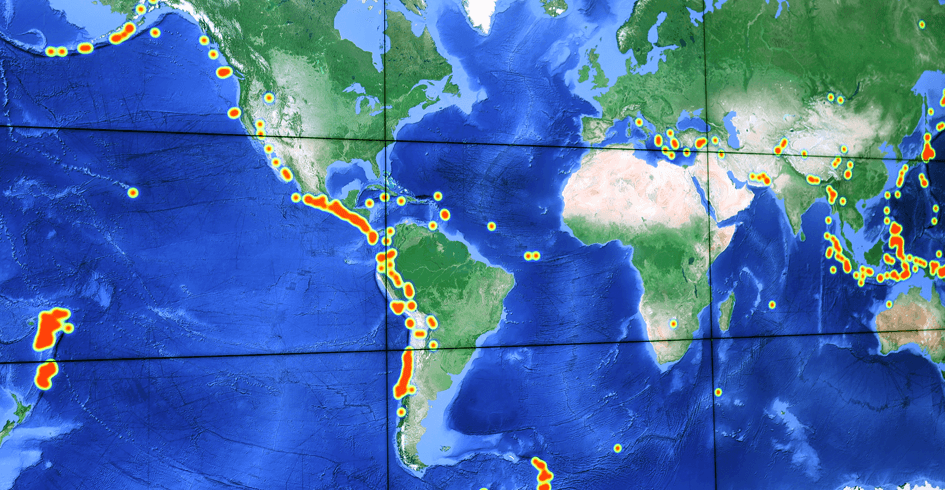
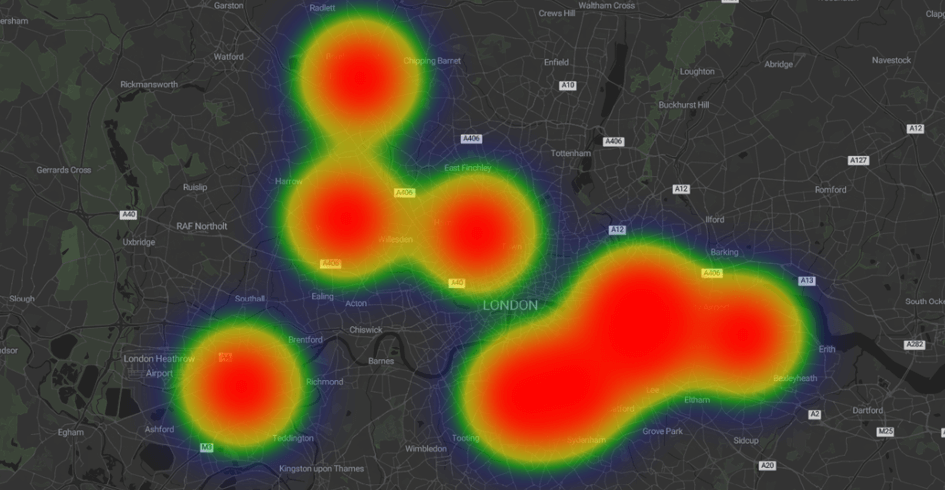
Heatmap Layer
Display data as a heatmap depending on values at coordinates.
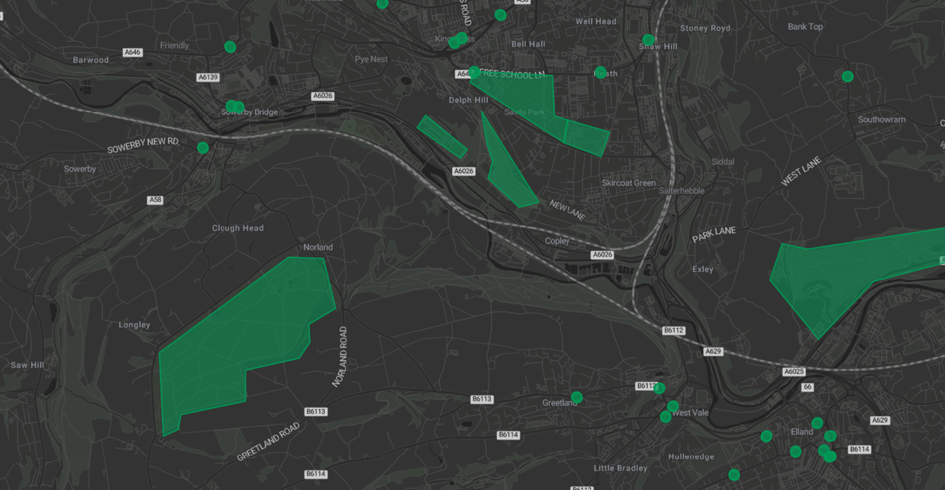
GeoJson Layer
Display GeoJSON Features such as Markers, Circles, Rectangles and other Polygons.
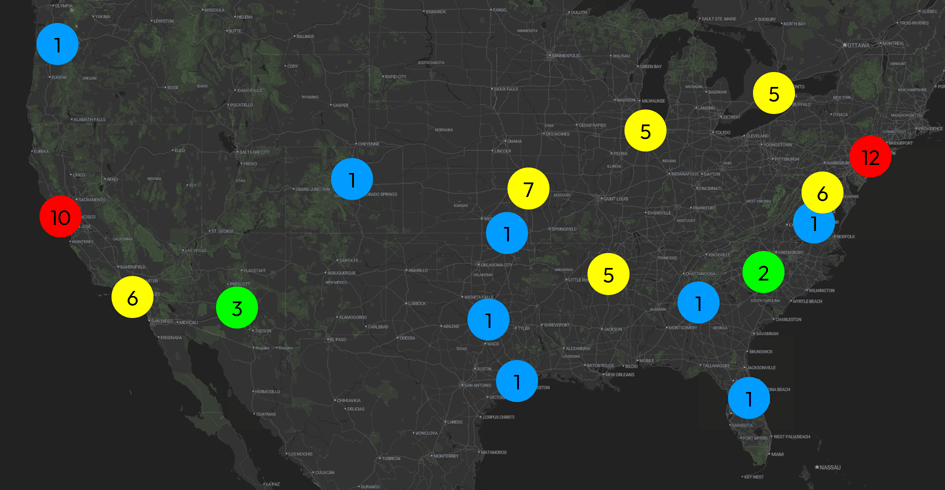
Cluster Layer
Display data as cluster markers which combines markers depending on the map zoom and display the count on each cluster marker.
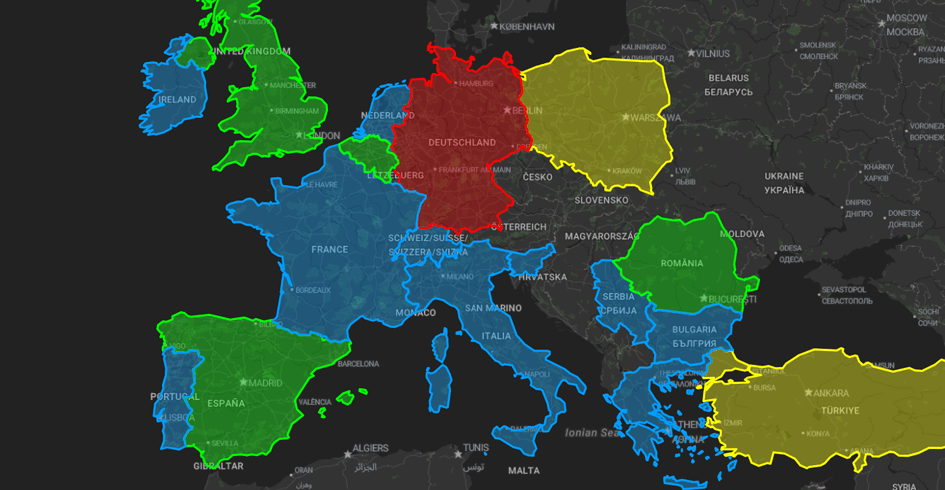
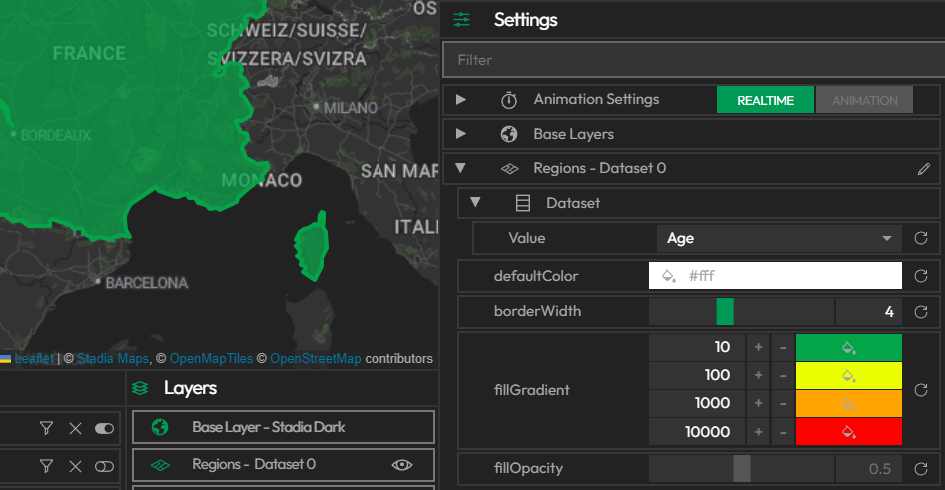
Territory Layer
Display a choropleth map where data does not have coordinates instead it has country names or state/region names.
Icon Layer
Display data as Icon Markers from 1000+ icons to select.
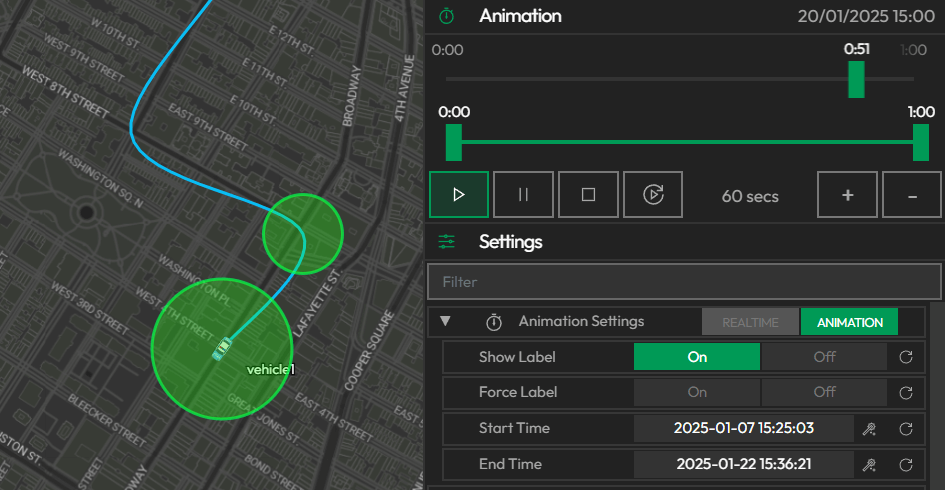
Tracking Layer
Track vehicles and observe their path history.
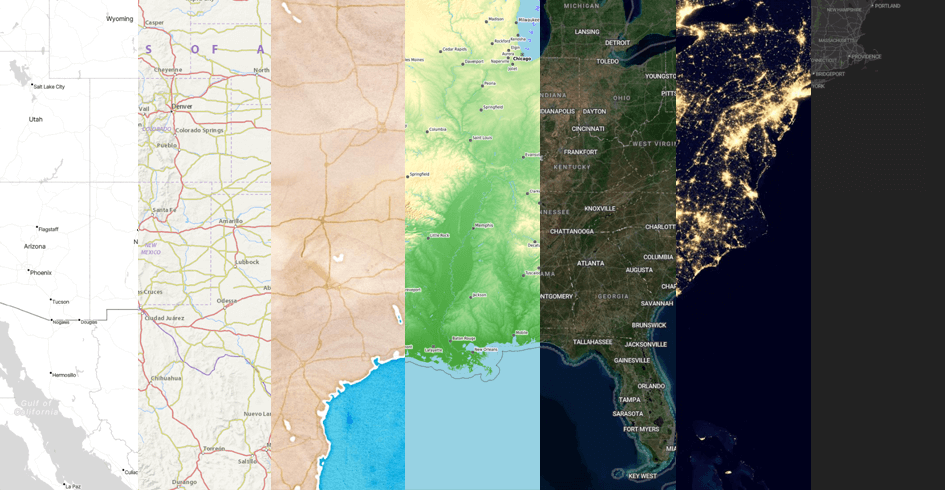
Tile Layer
Enable maps from custom tile services.
Configuration & Styling
Configure Display Options and Edit Styles for Layers.
Animating & Real-time Data
Animate Time Series Data. Play, Pause or Loop Animation or Observe Live Data Changes from Real-Time Data Sources on Maps.
Deploy to Screens
Deploy Your Maps to Video Walls and Dashboards at any Layout and Size through Display Module.