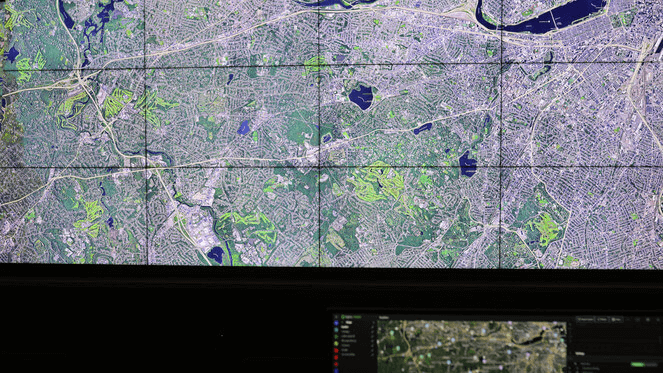
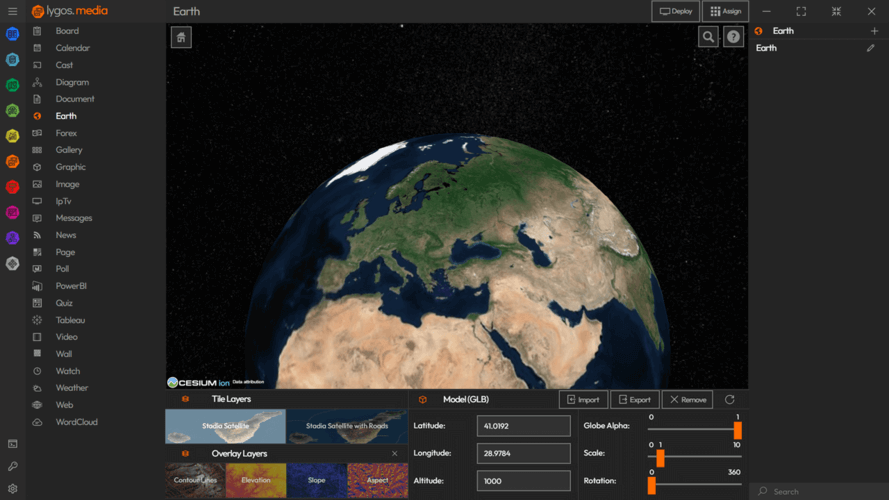
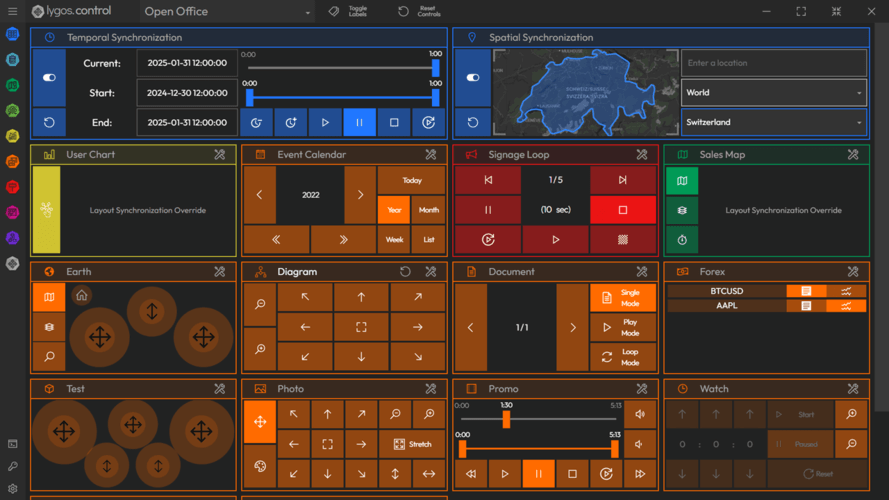
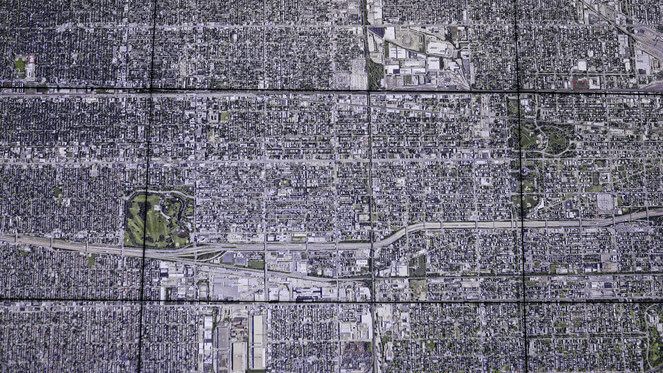
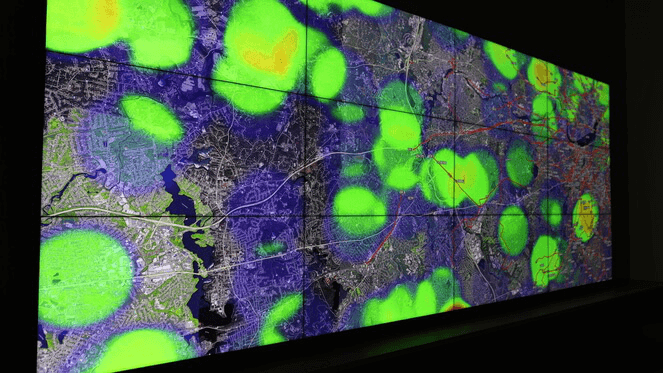
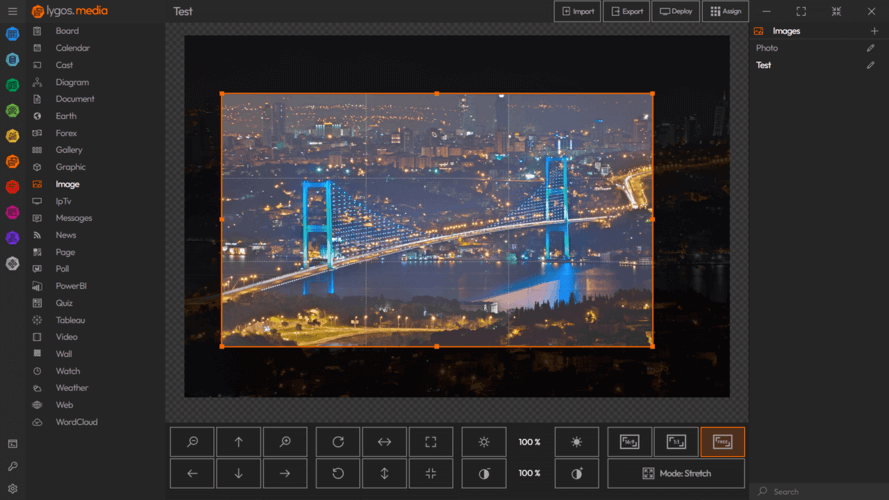
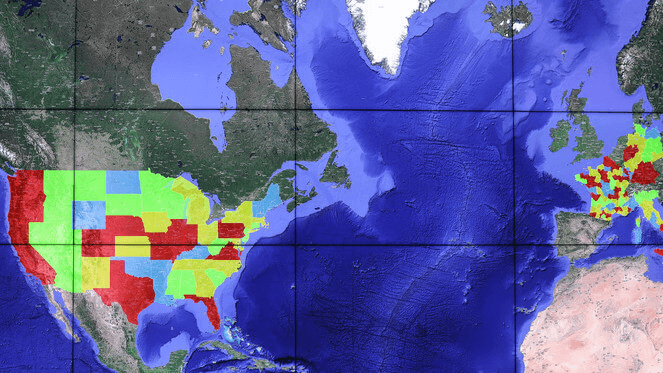
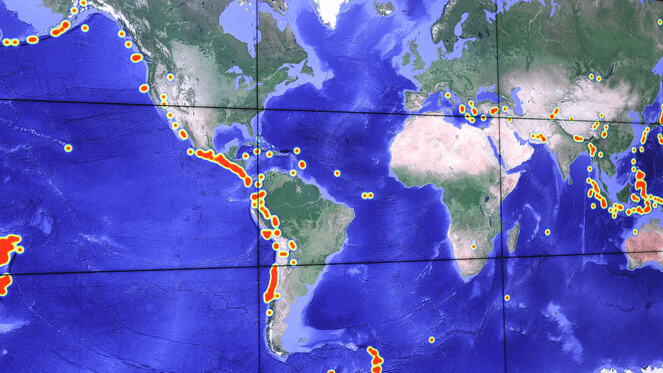
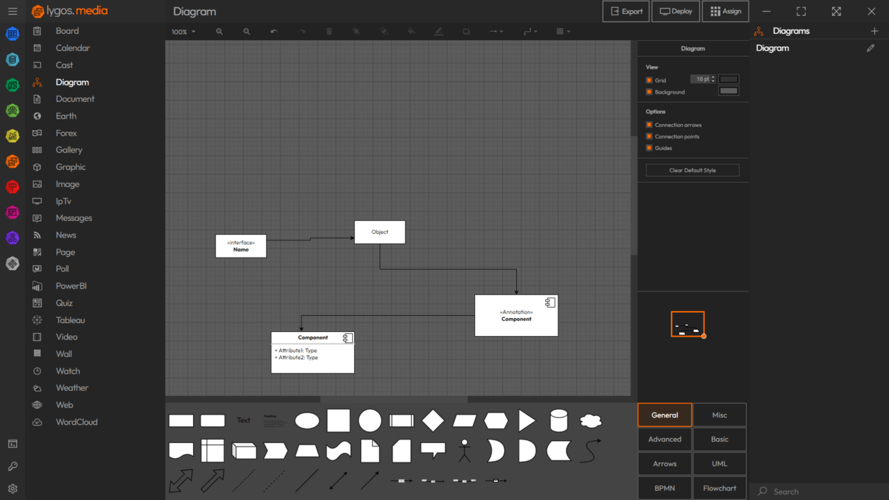
Visual Data Analytics Software for Video Walls & BI Dashboards
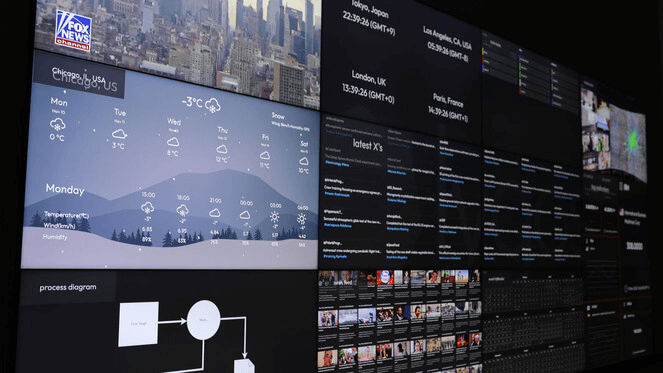
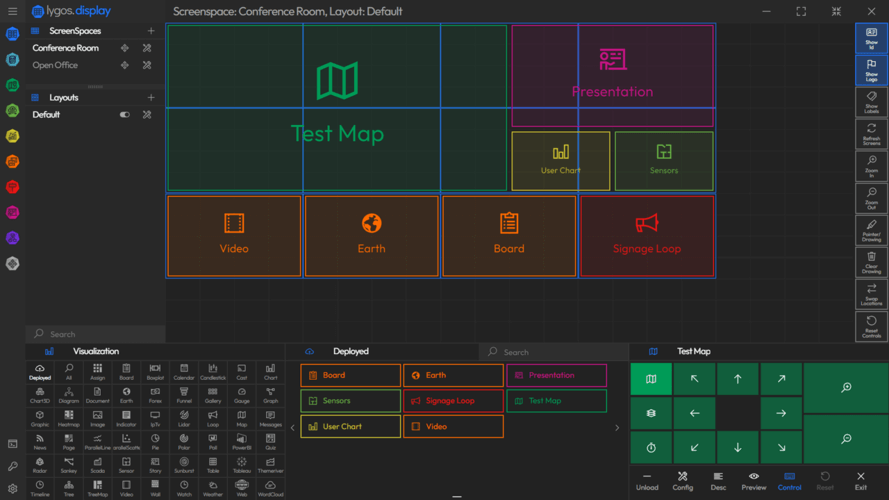
Lygos is a Video Wall Software for displaying Data Visualizations and Maps (GIS) at Control Rooms, Operation Centers and BI Dashboards. Any number of computers & screens can be used to create large seamless screen areas without requiring specialized equipment. Users of lygos can collaboratively create, deploy and control data visualizations, maps, multimedia on video walls and dashboards through clients installed on computers/tablets.