Animating & Real-time Data
Animate your time series data to visualize dynamic changes over time on the Visualization. This is useful for observing trends, movement, or live updates from real-time data sources.
Animation Types
There are two animation types, based on whether your data includes temporal (time-based) information:
1. Realtime
- The Visualization will update using only the most recently fetched data.
- Manual animation controls (Play, Pause, Loop) are disabled.
- Realtime is automatically selected if no time column exists in your dataset.
2. Animation
- Use this if your data includes temporal data (e.g., timestamps).
- Allows playback of historical or simulated data changes over time.
- You must define which fields are used for X and Y Axes:
- Go to:
Settings > Dataset - Set X Axis and Y Axis using column names from your dataset.
- Go to:
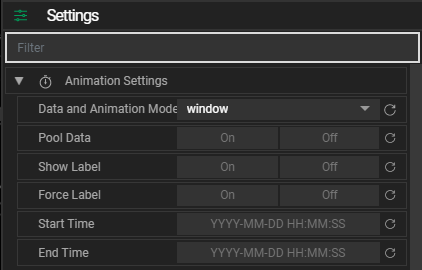
Animation Settings
- Show Label
- Displays the current time of the animation on the screens.
- Force Label
- Forces the label to appear even if labels are globally disabled for the layout.
- Start / End Time
- Define the time interval to animate. This must match the time range in your dataset.
Base Parameters
Customize the visual appearance of your animation:
- Color schemes
- Title
- Legend visibility
- Axes appearance
- Text styles
- And more...

