Data Formats
Data formats help determine which data can be used in which visualizations on a video wall and how. For example, map data contains coordinates and is classified as Spatial, while yearly sales data includes time values and is categorized as Temporal.
Users can easily determine the format of their data using the Data Format UI tool. In this tool, users analyze their raw data, define its structure, and assign dimensions to create a schema.
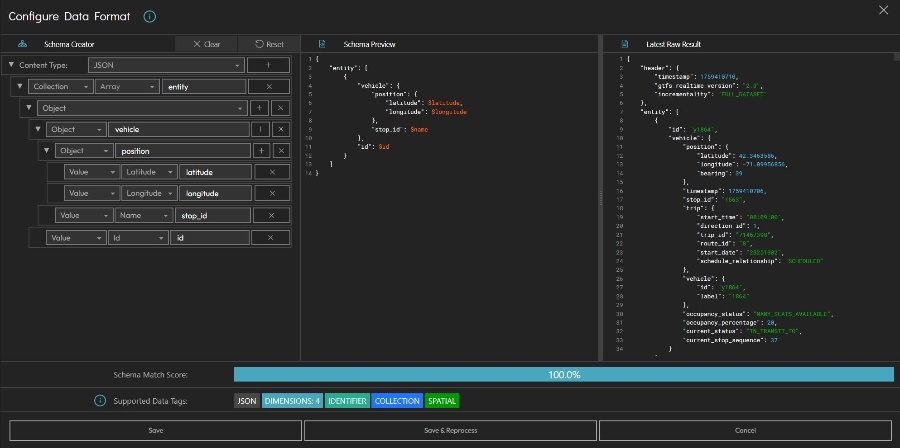
The system then calculates which visualizations the data can be used with and summarizes the result using data tags. These tags are determined according to the schema.
Not all data can be used in every visualization. Some visualizations require specific data formats. Data tags help identify your data format and indicate which visualizations are compatible.
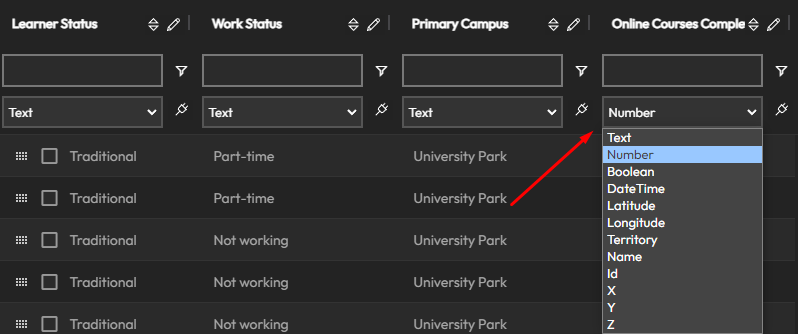
Note: For file-based data sources, the data format is automatically determined (except spreadsheets). In spreadsheets, you can assign a type for each column (dimension).
Summary of Data Tags:
- Dimensions:
- Desc: Number of columns (value fields)
- Require 2+: Boxplot, Candlestick, Chart3D, ParallelLine, ParallelScatter, ThemeRiver
- Require 1+: Chart, Funnel, Gauge, Indicator, Pie, Polar, Radar, Timeline
- Temporal:
- Desc: Data with DateTime values
- Visualizations: All that support animation
- Requires: DateTime
- Collection:
- Desc: Data in a collection (array or dictionary)
- Visualizations: No direct requirement, but may affect dimensions
- Requires: Collection
- Spatial:
- Desc: Geographical (GIS) data
- Visualizations: Maps (marker, icon, cluster, heatmap)
- Requires: Latitude/Longitude or [lat, long]
- Identifier:
- Desc: Contains name or ID
- Visualizations: Maps (tracking layer)
- Requires: Name or ID
- Territorial:
- Desc: Choropleth map data
- Visualizations: Maps (territory layer)
- Requires: Territory (country, city, or region)
- PointCloud:
- Desc: Lidar data
- Visualizations: Lidar
- Requires: X, Y, Z
- Graph:
- Desc: Graph data
- Visualizations: Graph, Sankey
- Requires: Nodes and edges
- Tree:
- Desc: Tree data
- Visualizations: Tree, Treemap, Sunburst
- Requires: Flat or nested tree
- Sensor:
- Desc: Sensor data
- Visualizations: Sensor
- Requires: Name and reading
- Geojson:
- Desc: GeoJSON data
- Visualizations: Maps (GeoJSON layer)
- Requires: GeoJSON or KML
- Messages:
- Desc: Messages or events
- Visualizations: Messages
- Requires: Title (name) and description (message)
- Optional: Categories (string or string array)