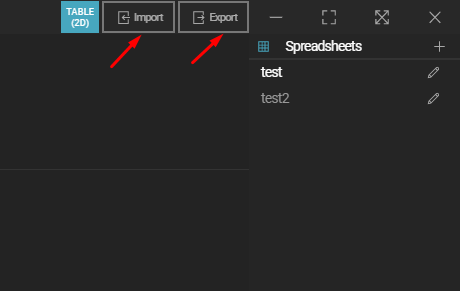
SpreadSheet
The Spreadsheet is a local data source designed for importing and editing tabular data. This data source can be used by visualizations and maps on the video wall to create charts and data layers on maps.
Importing and Exporting
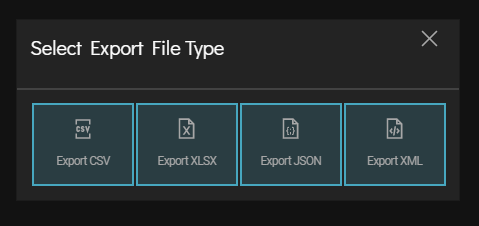
- Supported Formats: Import or export spreadsheets in CSV, XLSX, JSON, and XML formats.
- Exporting: Specify the desired file format when exporting your data (CSV, XLSX, JSON, and XML formats).
Editing the Table
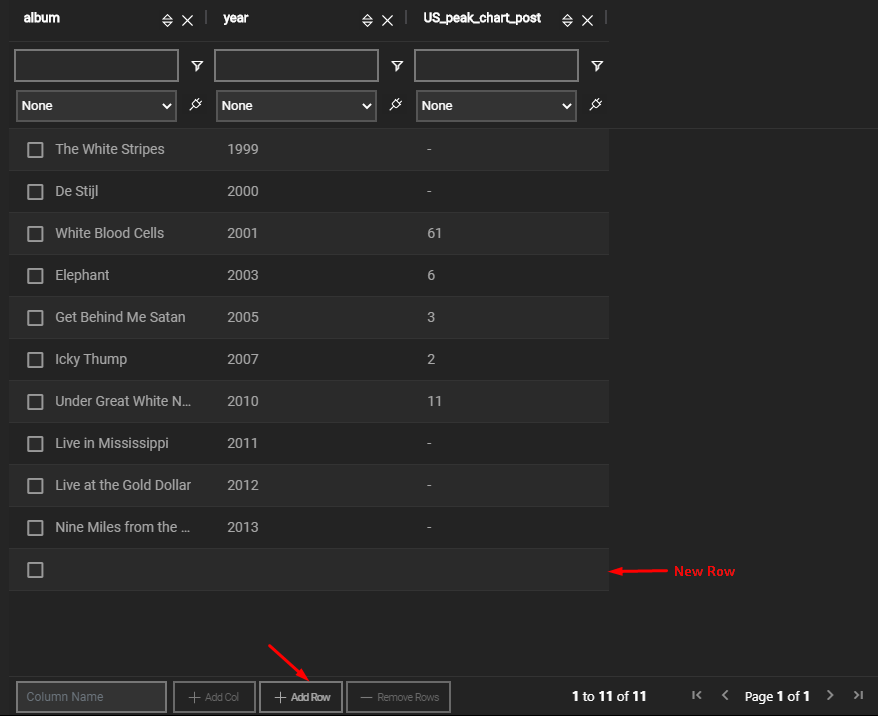
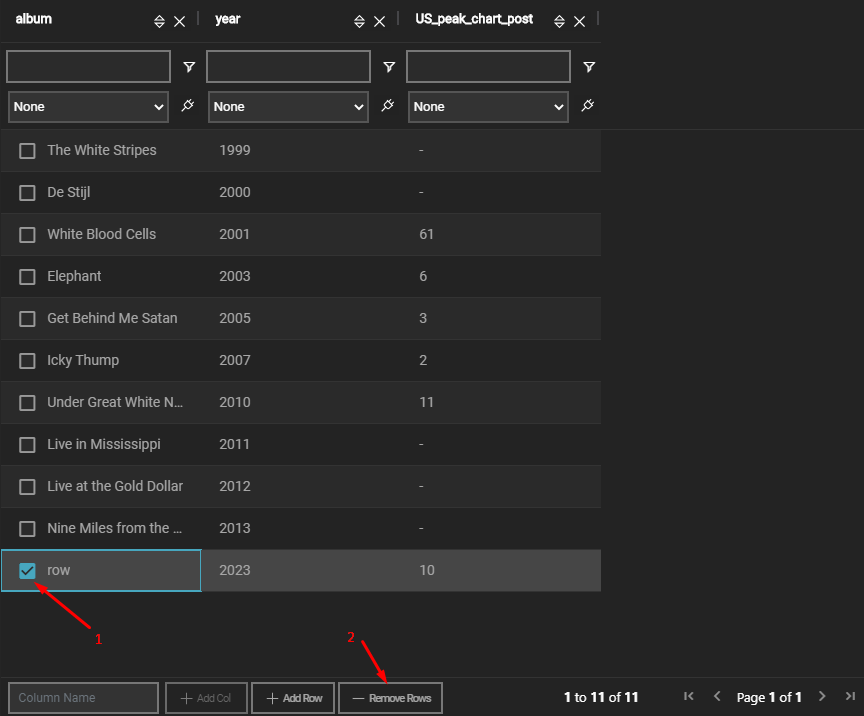
Adding and Removing Rows
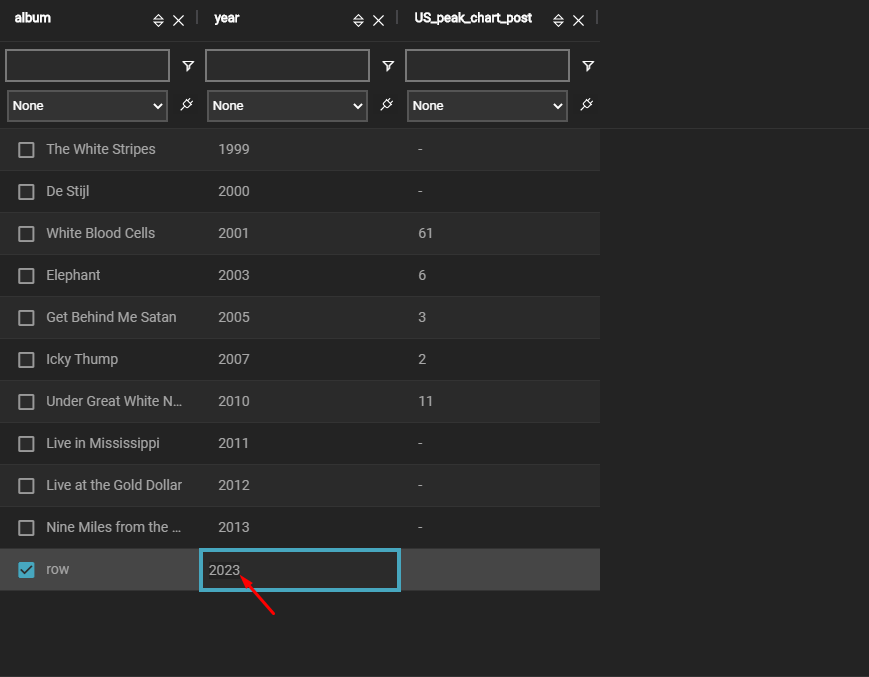
- Add Rows: Click the Add Row button on the bottom menu bar to add a new row.
- Remove Rows: Select rows and click the Remove Row button to delete them.
Adding and Removing Columns
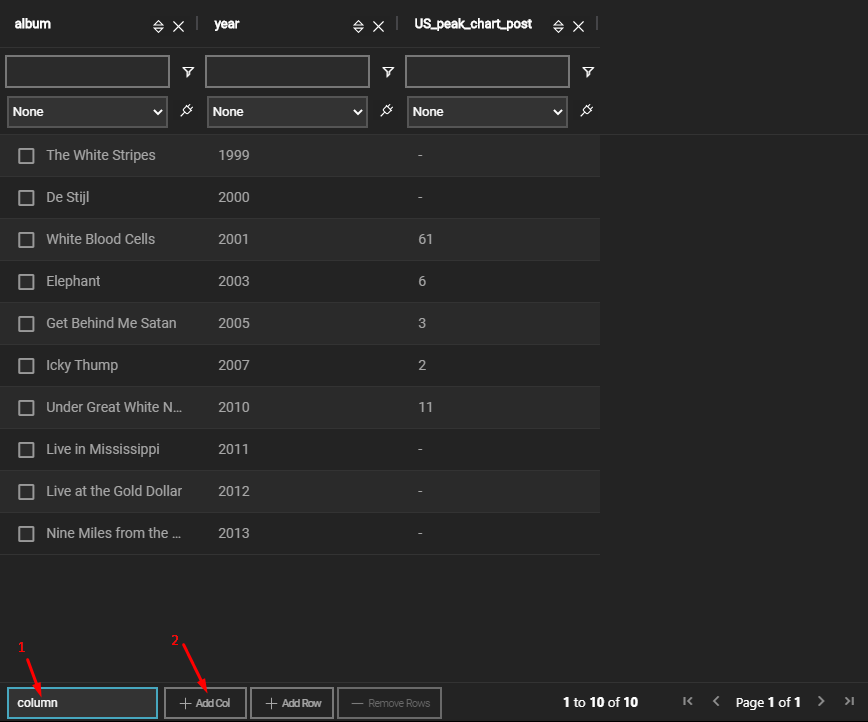
- Add Columns: Input a column name and click the Add Col button to add a new column.
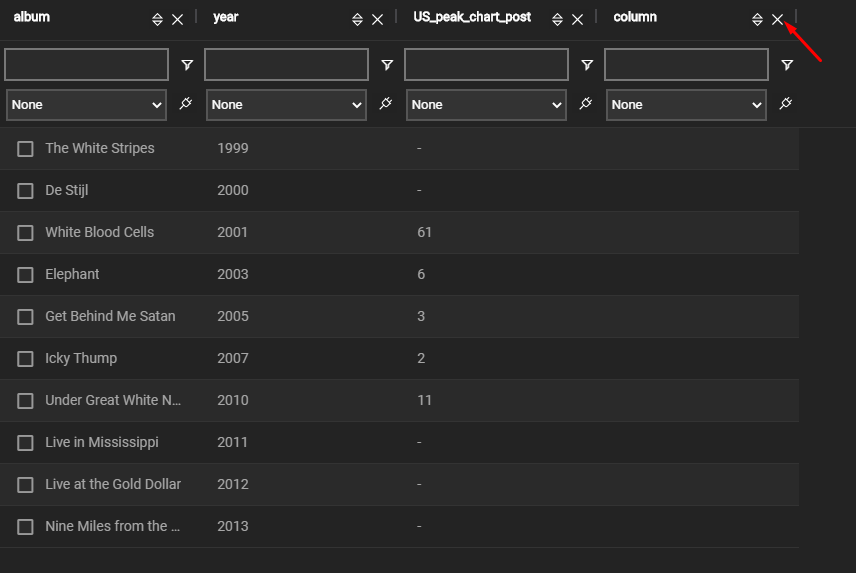
- Remove Columns: Click the X button in the top-right corner of the column to remove it.
Editing Cells
- Select a cell and input any value to change its content.
Resizing Columns
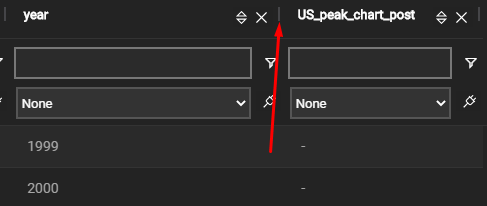
- Drag the column separators left or right to adjust the column width.
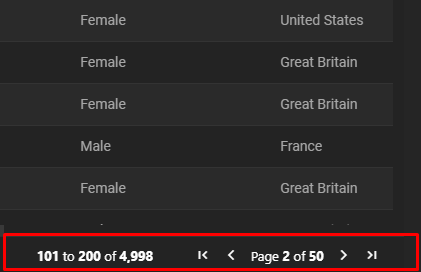
Navigating the Table
- Use the pagination controls at the bottom to switch between pages or jump to the first/last page.
Sorting and Filtering
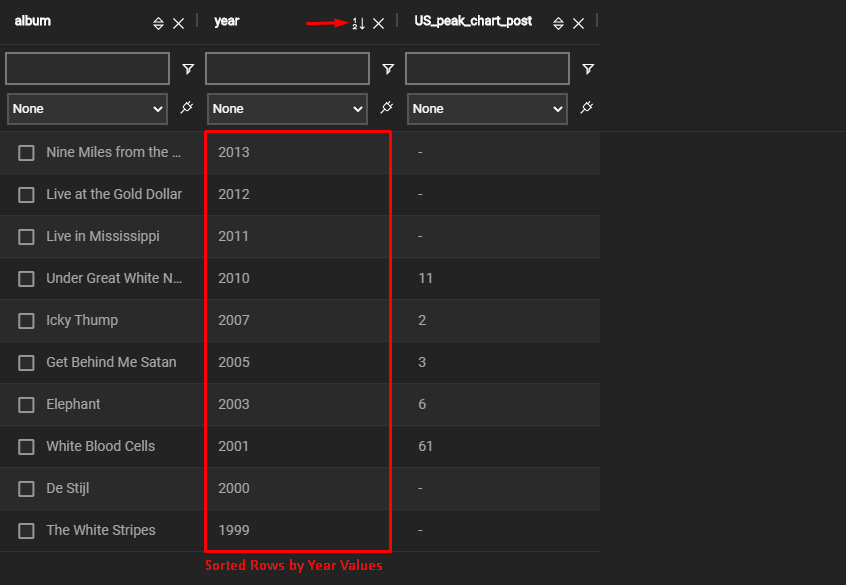
Sorting Rows
- Sort rows by selecting a column and choosing ascending or descending order.
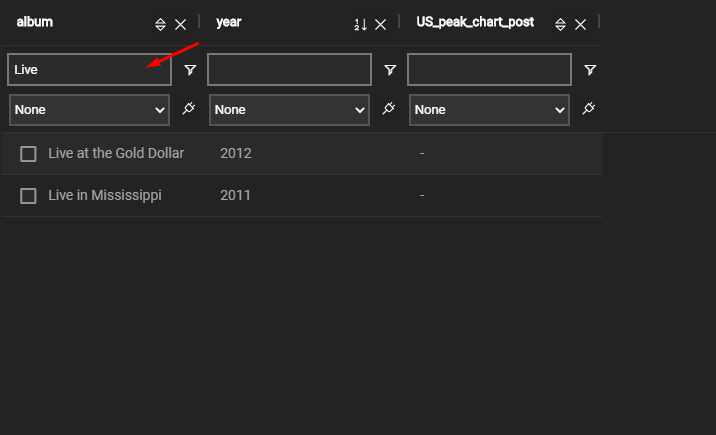
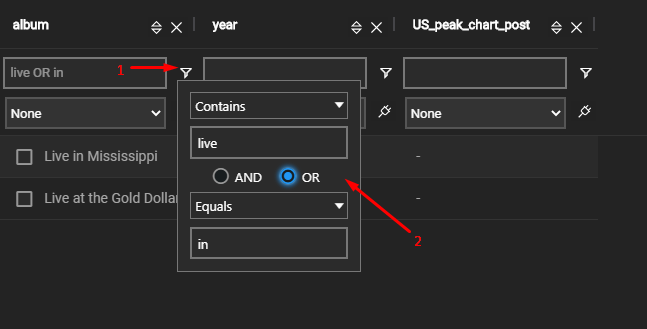
Filtering Rows
- Apply filters to rows based on column values. Filters in the editor do not affect connected visualizations or maps.
- Edit filters using search strings and logical operators.
Data Formats and Visualization Integration
- Assign Data Formats: To use your data in visualizations, assign data formats to the columns.
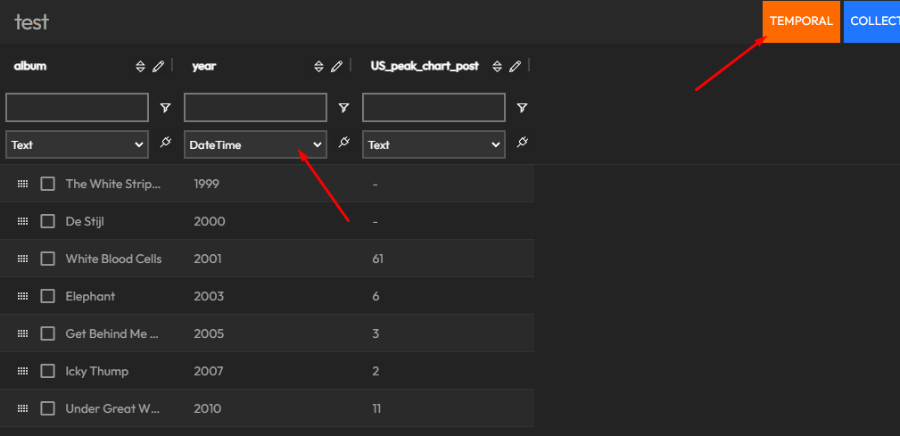
- Examples:
- Identifying a column as Time enables temporal animations in visualizations.
- Identifying a column as Coordinates allows the data to be used in maps.
- DataFormat Tags: DataFormat tags appear at the top-right corner of the editor and indicate the supported formats for this source.
- Visualizations may require specific tags to use a data source.
- If a data source doesn’t appear in the visualization list, ensure the required tags are present.
For more details, please refer to the DataFormat documentation.