Database
Connect and stream from wide range of databases to power your data visualizations on video walls and dashboards.
🔌 Supported Databases
- Relational: Oracle, MySQL, Microsoft SQL, PostgreSQL, SQLite, MariaDB, IBM DB2, Azure SQL, Google Bigtable, Snowflake
- NoSQL: MongoDB, Redis, Amazon DynamoDB, Cassandra, Neo4J
- Search Engines: Elasticsearch
⚙️ Key Features
- You can have multiple Queries per database.
- Each Query Counts as a Data Source and can be used from Visualizations.
- Connect to any supported database directly from Lygos.
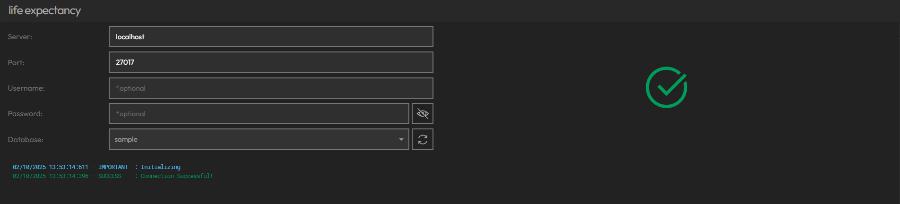
- Each database may require different parameters for connection.
- You can create and check a new connection at Database View:
- Afterwards, you can Create, Edit, or Remove Queries to fetch and process the data you need.
- You can go to Query view by clicking into a query on the right list:
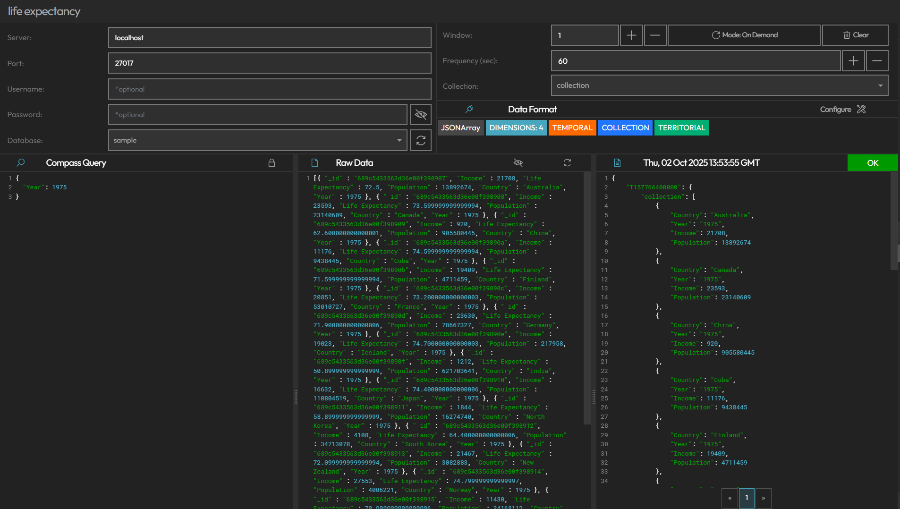
- On this View, you can input further options, enter query and configure polling frequency, window size and polling mode.
- Query Options: Options such as connection options, or collection/table depending on database type can be inputted per query.
- Database Query: Enter a query to execute on the database (bottom left pane)
- Polling Frequency: You can control how often your data is refreshed.
- Data Window Size: This is how many past results are stored in your data window.
- Data Windows can be used for animations of data visualizations.
- If Data does not have datetime values, data receival time can be used as its temporal value, and thus be animated.
- For example, polling data every minute and with window of 60, you can animate your last hour with 60 data points on data visualizations and maps.
- Data Polling Mode: You can determine if the query is polled on demand or on in the background.
- On Demand: Data is temporary. It is polled only if a visualization is actively using this data source on the screens.
- On Background: Data is persistent. It is polled on the background and data window is stored when app closes or relaunches.
- Data Format: Determine Data Format of incoming data through our Data Format Tool.
- Preview Results: instantly to validate your data before use in visualizations.
- Raw Data: You can see data received as result of your query or errors if database returned an error.
- Formatted Data: Your final data source after your data format is applied.