Animating Data & Real-time Data
Animate your time series data to visualize dynamic changes over time on the Map. This is useful for observing trends, movement, or live updates from real-time data sources as part of Video wall Data Analytics at Control Rooms.
Animation Types
There are two animation types, based on whether your data includes temporal (time-based) information:
1. Realtime
- The Map will update when there is a data change on connected data sources.
- Manual animation controls (Play, Pause, Loop) are disabled.
- Realtime is automatically selected if no time column exists in your dataset.
- If data includes temporal data, only the latest data is shown.
2. Animation
- Can be used if your data includes temporal data (e.g., timestamps).
- Allows playback of historical or simulated data changes over time.
Animation type can be selected from Data Input item on Settings.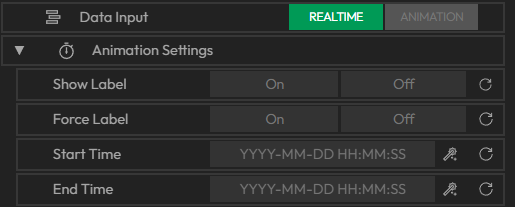
Animation Settings
- Show Label: Displays the current time of the animation on the screens.
- Force Label: Forces the label to appear even if labels are globally disabled for the layout.
- Start / End Time: Define the time interval to animate. This must match the time range in your dataset.
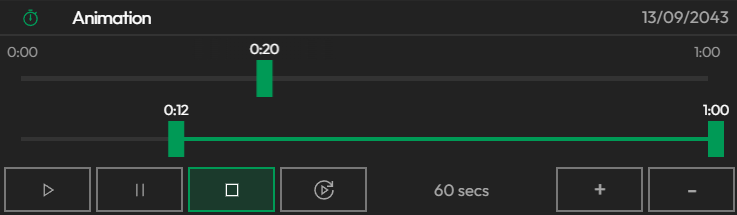
Animation Controls
Customize the visual appearance of your animation:
- You can determine duration of the animation (Bottom Right).
- Crop and Slide Min-Max Window on overall duration to limit playback (Second Slider).
- Manually move Play slider to go to a certain time in data (First Slider).
- You can see the current time in data (Top Right).
- Use Play/Pause/Stop and AutoPlay Buttons (Bottom Left)
- AutoPlay does not play animation on editors. Instead it start animation when a layout with this map is deployed to videowall or dashboards (screenspace).