Cluster Layer
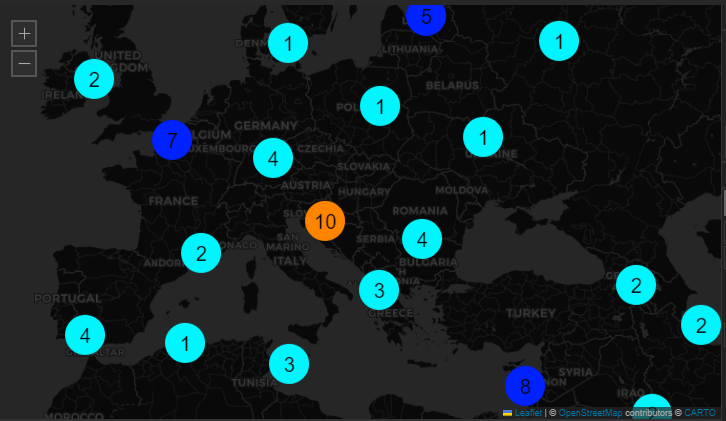
The Cluster Layer aggregates geographically proximate data points into unified clusters based on the active zoom level, displaying the total count of localized markers. This feature is designed to optimize map performance and readability when managing highly dense datasets. By effectively reducing visual clutter, operators can maintain clear situational awareness, whether analyzing concentrated regional data on a localized workstation or projecting a comprehensive global summary across an operations center video wall. Administrators retain full control over cluster radius, color gradients, and zoom-based rendering thresholds to ensure scalable, precise data representation at any magnification level.
After loading your data into a layout and selecting Cluster Layer as the type, the Cluster Layer Settings will become available under the Settings tab.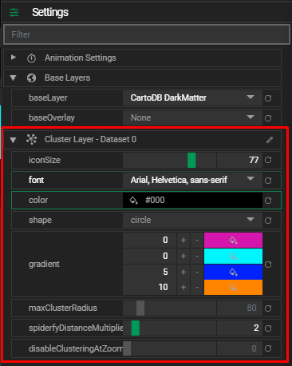
Cluster Layer Settings
Customize how clustered data appears on the map:
- Icon Size
- Adjust the size of the cluster icons.
- Font
- Change the font family used for the marker text (count labels).
- Color
- Set the font color for the marker text.
- Shape
- Choose a shape for the cluster icon (e.g., circle, square).
- Gradient
- Assign color intervals for clusters based on size. Four preset options are available to visually differentiate cluster sizes.
- Max Cluster Radius
- Set the maximum pixel radius a cluster can span from its center. Smaller values create smaller and more frequent clusters.
- Spiderfy Distance Multiplier
- Increase this value to space out individual markers when a cluster is expanded (spiderfied). Useful when using large marker icons.
- Disable Clustering At Zoom
- Define a zoom level threshold below which clustering is disabled. At or above this level, individual markers will appear separately.
Tips
- Use clustering for datasets with dense marker distributions to reduce visual clutter.
- Combine with Marker Layers to show both overview (clusters) and detail (individual points) depending on zoom.