Heatmap Layer
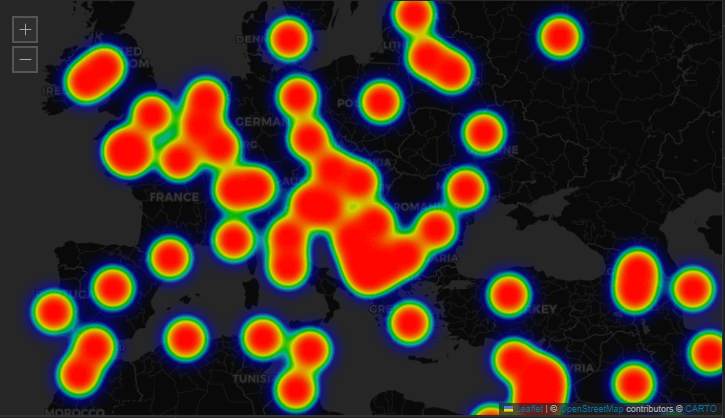
The Heatmap Layer visualizes data concentration and intensity across geographic regions by rendering coordinate based values as color coded gradients. This tool is designed to identify spatial patterns within dense datasets, such as traffic congestion, demographic distribution, or incident clustering. When deployed to a large scale video wall or central monitoring display, the heatmap provides operators with immediate visibility into critical hotspots without obscuring the underlying map details. Administrators can precisely control the visual output by configuring custom color gradients, point radius, and blur parameters to meet specific operational requirements.
Getting Started
- Load your dataset following the standard data loading steps.
- Go to the Layout View, and open the Heatmap Layer Settings under the Settings tab.
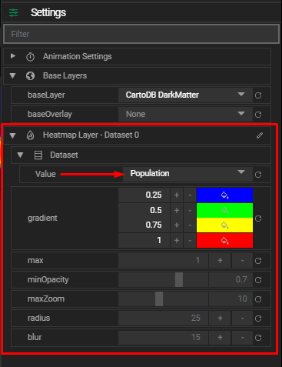
- Under the Dataset setting, select a Value to base your heatmap on (e.g., population, activity level, traffic, etc.).
Once a value is selected, the Heatmap will automatically render based on those coordinates and values.
Heatmap Layer Settings
You can adjust the appearance and behavior of your heatmap using the following settings:
- Gradient: Define a custom color gradient using up to four colors to represent different intensity levels.
- Max: Set the maximum point intensity. Higher values create stronger heat points.
- Min Opacity: The minimum transparency level for the heatmap. Useful for subtle visualizations.
- Max Zoom: Zoom level at which points reach maximum intensity. Defaults to the map’s max zoom.
- Radius: Radius of each data point's influence on the heatmap.
- Blur: Adjusts the blur level, smoothing out or sharpening the transitions between heat areas.