Territory Layer
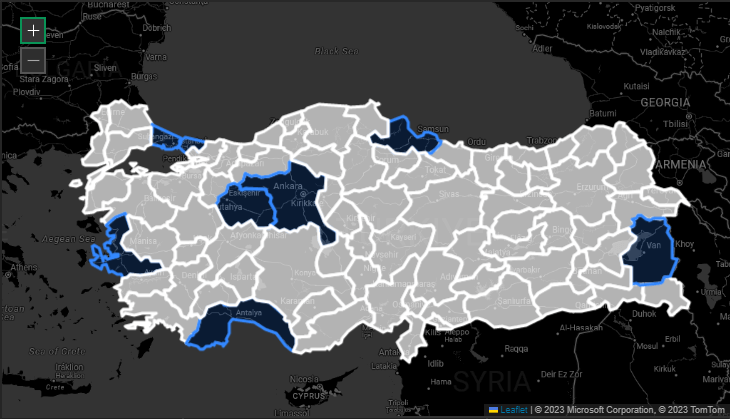
The Territory Layer generates a choropleth map by shading administrative regions. Such as countries, states, or provinces based on underlying dataset values. Designed specifically for datasets containing standardized regional names rather than precise latitude and longitude coordinates, this tool facilitates macro level spatial analysis. When broadcasting geopolitical metrics or nationwide performance data across an operations center video wall, the choropleth visualization provides immediate contextual clarity at a massive scale. Administrators can further refine the display by configuring custom fill gradients, adjusting boundary thickness, and utilizing visibility filters to isolate active territories.
After loading your data into a layout and choosing Territory Layer, you can access the Territory Layer Settings from the Settings tab.
How to Visualize Your Data
To activate the Territory Layer:
- Go to the Dataset setting.
- Select a Value from your data. This value will be used to color regions.
- Choose the correct Region setting:
- If your data uses country names, select World.
- If your data uses states/regions, choose the corresponding country.
Once set, your data will be visualized across the map regions accordingly.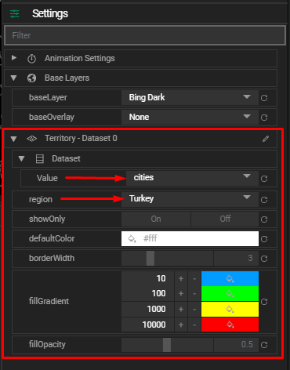
Territory Layer Settings
Customize the appearance of the territory map with the following options:
- Region
- Defines the scope of your map:
World– for country-based data.Selected Country– for state or regional data within a country.
- Show Only
- On – Only display regions that exist in your dataset.
- Off – Show all regions, with regions lacking data shown in the default color.
- Default Color
- The background color for regions not included in your dataset.
- Border Width
- Adjust the thickness of borders between regions.
- Fill Gradient
- Create a color gradient using up to four color intervals to represent value ranges across regions.
- Fill Opacity
- Controls the transparency of region fills (0 = fully transparent, 1 = fully opaque).
Tips
- Make sure region names in your data match standard naming conventions (e.g., "United States", not "USA").
- Use the Show Only option to declutter the map when focusing on specific regions.