GeoJson Layer
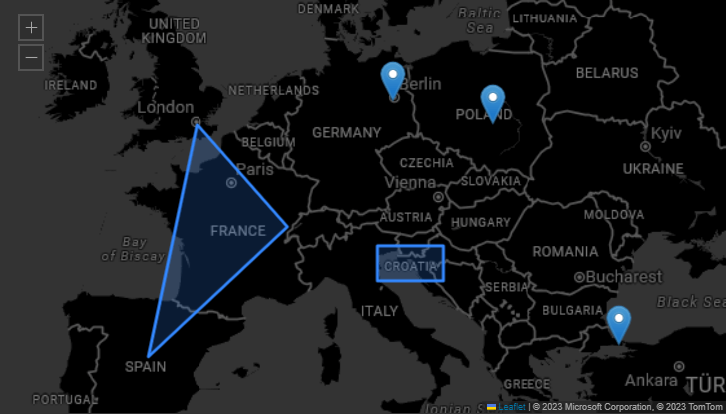
The GeoJSON Layer enables the integration of complex geographic overlays. Such as custom polygons, regional boundaries, and infrastructure networks directly onto the base map. By importing standard spatial files, administrators can map detailed vector features and apply property based filters to isolate specific data subsets. Whether analyzing detailed municipal zoning on a local workstation or projecting sweeping, multi layered territorial boundaries across an operations center video wall, this layer provides granular styling controls for stroke, fill, and opacity to ensure precise, scalable geographic visualizations.
Supported Data Formats
- GeoJSON
- KML
Once your data is loaded into a layout, the GeoJSON Layer Settings will appear under the Settings tab.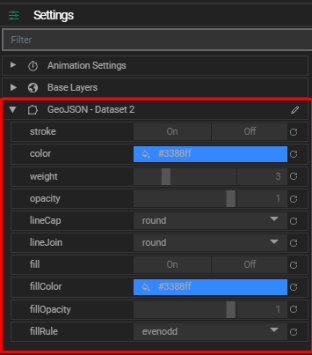
GeoJSON Layer Settings
Customize the appearance and behavior of your GeoJSON features with the following options:
- Stroke: Toggle stroke visibility. Set to
falseto remove borders from polygons or circles. - Color: Defines the stroke (border) color.
- Weight: Sets the stroke width in pixels.
- Opacity: Adjusts the stroke transparency.
- LineCap: Sets the shape at the end of a line. Options include
butt,round, andsquare. - LineJoin: Sets the shape at line corners. Options include
miter,round, andbevel. - Fill: Toggle fill visibility inside polygons or circles. Set to
falseto disable fill. - Fill Color: Defines the inner fill color.
- Fill Opacity: Adjusts the transparency of the fill.
- Fill Rule: Determines how the interior of shapes is filled (
nonzero,evenodd).
Tips
- Use property filters to highlight specific features based on their data (e.g., region name, category).
- Combine GeoJSON layers with other layer types for richer geographic visualizations.