How to Display Data Driven Signage in Offices
Transforming standard office monitors and corridor displays into dynamic communication tools is essential for modern corporate environments. Instead of relying on static images, the Lygos visual data analytics platform allows you to deploy live, data driven digital signage.
This guide will walk you through setting up office displays, connecting live data feeds, building engaging visualizations, and managing multi purpose signage loops to keep your workforce informed and aligned.
1. Setting Up Office Displays and Small Video Walls
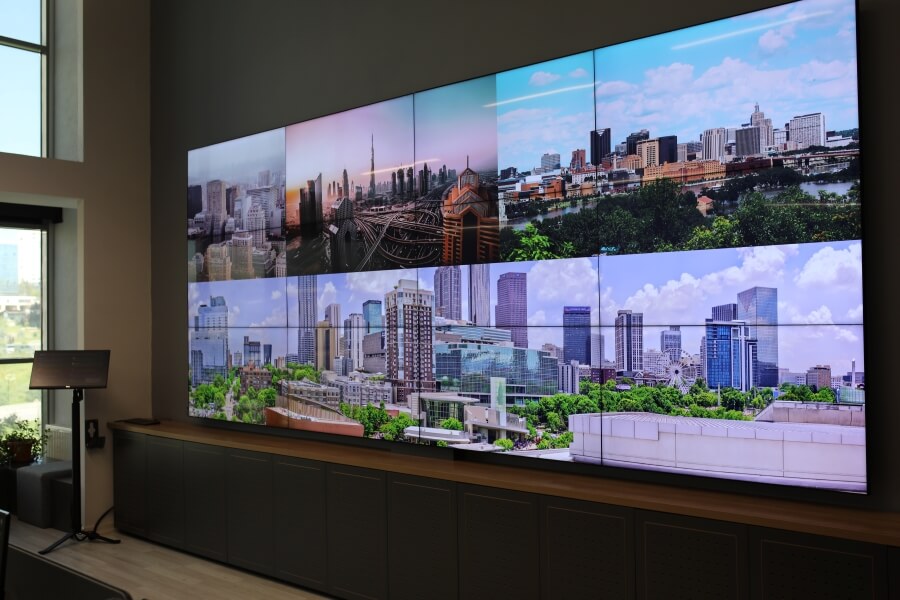
The first step is establishing your display infrastructure. You can install Lygos Screen Clients on commercial computers connected to individual monitors placed along office corridors, or configure a small 2x2 video wall in a central open office area.
Open the Display Module and create a dedicated Screenspace for these monitors. Even if the screens are distributed across different floors, grouping them into a specific Screenspace allows administrators to manage their content and power states centrally.
2. Connecting Live Operational Data Sources
To make your signage truly data driven, you need to connect live metrics using the Data Module. Lygos supports various methods to continuously feed your office displays with fresh information.
- Spreadsheet Files: Upload CSV or Excel files for static goals, company milestones, or monthly performance targets.
- File Watch: For automated local updates, configure FileWatch to monitor a specific server file. Whenever an internal system updates that file, the changes are instantly pushed to your screens.
- REST APIs: Connect to external services to poll live metrics, such as third party software statuses or live financial market data.
- Databases: Establish secure connections to your internal relational or NoSQL databases. Configure background polling to continuously extract live sales figures, support ticket volumes, or production metrics.
3. Building Live Data Visualizations and Maps
Raw numbers must be translated into engaging visuals so employees can process them at a glance while walking through the office.
- Creating Visualizations: Navigate to the Visualization Module to build high impact charts. Connect your live data sources to create prominent KPI indicators, dynamic bar charts, or gauge meters that instantly communicate departmental performance.
- Creating Geographic Maps: If your company operates globally, use the Maps Module. You can plot active sales regions using a Territory Layer or display the locations of remote teams using a custom Icon Layer on a high resolution GIS map.
4. Designing Layouts and Deploying to Screens
With your visual assets ready, return to the Display Module to construct your collage. Select your office Screenspace and create a new Layout. Divide the screen area into a grid format that accommodates multiple pieces of content simultaneously.
Drag and drop your created data visualizations and maps into the layout slots. Once the layout is configured, deploy it directly to the corridor monitors or open office video wall. Because the underlying data sources are polling in the background, these screens will now update in real time automatically.
5. Leveraging Multi Purpose Digital Signage Features
Office displays should serve multiple functions throughout the day. Using the Signage and Media modules, you can expand the utility of your screens beyond just data analytics.
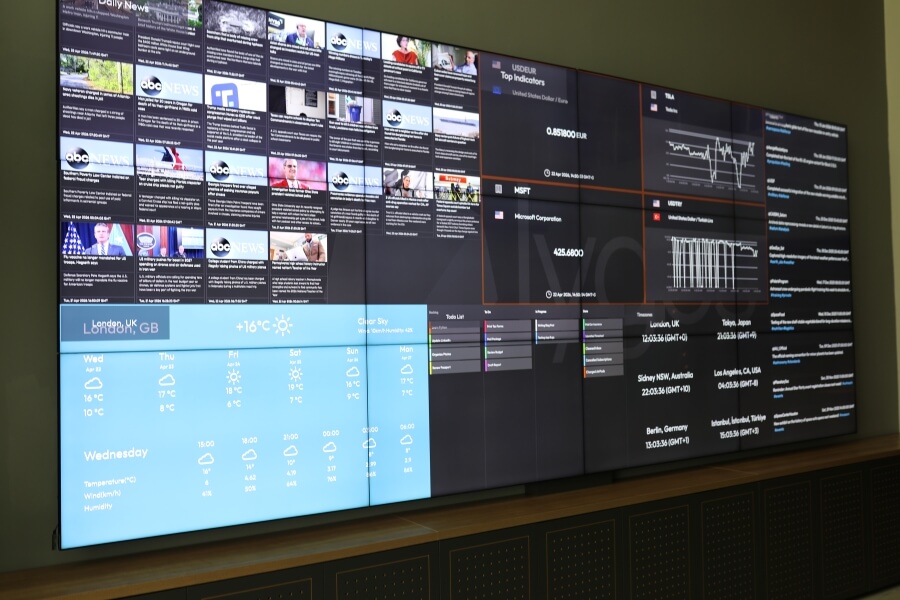
- Automated Signage Loops: Instead of a static layout, create a Signage loop. Configure the system to display a data dashboard for thirty seconds, then transition to an HTML Page showing the latest HR announcements, followed by a corporate promotional video.
- Everyday Office Media: Enhance the loop by adding live RSS News feeds, local Weather updates, and multi city Timezone Clocks to keep employees connected to global events.
- More: Connect live messages, filter and display with Messages. Follow forex and more market pairs with customized market pair layout with Media Forex.
- Collaborative Tools: Create multi purpose dashboards. During team huddles in the open office, you can temporarily switch the display to show an interactive Kanban Board or cast a presentation directly to the video wall.
- Smart Automations: Use Video Wall Automations to power on the displays automatically before the morning shift, and transition them to display a Custom Background with the company logo after business hours.