How to Monitor Real Time Operations from Video Walls in Control Rooms
Maintaining absolute situational awareness in a mission critical control room requires continuous access to live information. By utilizing the Lygos visual data analytics platform, organizations can transform standard commercial displays into a synchronized, multi million pixel operational canvas.
This guide details the complete workflow for setting up a video wall to monitor live data, track geographic assets, integrate surveillance feeds, and foster team collaboration during real time operations.
1. Establishing Your Video Wall Architecture
Before streaming live metrics, you must construct your digital canvas. Open the Display Module and create a new Screenspace. This action logically binds your individual physical screens into a single seamless video wall. Once your screens are connected to this network, they are ready to display synchronized real time intelligence across the entire grid.
2. Connecting Real Time Data Sources
Operational monitoring relies on continuous data flow. Using the Data Module, you can integrate external metrics that update instantly.
- Databases: Connect to relational or NoSQL databases. Set your polling mode to Background so the Lygos server continuously fetches new operational data even when specific visualizations are not actively open on a screen.
- REST APIs: Link third party services and live status feeds to stream critical metrics directly into your system.
- FileWatch: Monitor local server files that are constantly updated by external analytics scripts. Any changes to these files immediately trigger updates across your network.
3. Building Operational Visualizations
Raw numbers must be converted into readable analytics for quick decision making. Navigate to the Visualization Module to build your live charts.
- Integrate Data: Open the Data and Logic tab, select your continuously polling data sources, and toggle them on to feed the visualization engine.
- Configure and Style: Configure your data dimensions to line graphs, gauges, or KPI indicators. Apply logical filters to isolate critical warning thresholds and customize color schemes to match your control room dark mode environment.
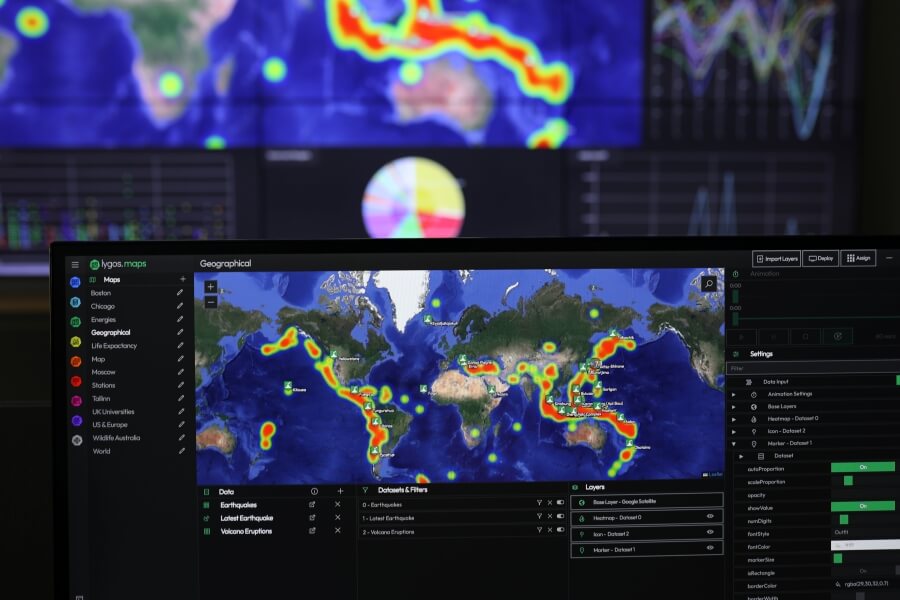
4. Designing Real Time GIS Maps
For geographic monitoring, the Maps Module allows you to track assets globally or locally.
- Add Spatial Data: Connect live tracking coordinates or live incident reports to your map.
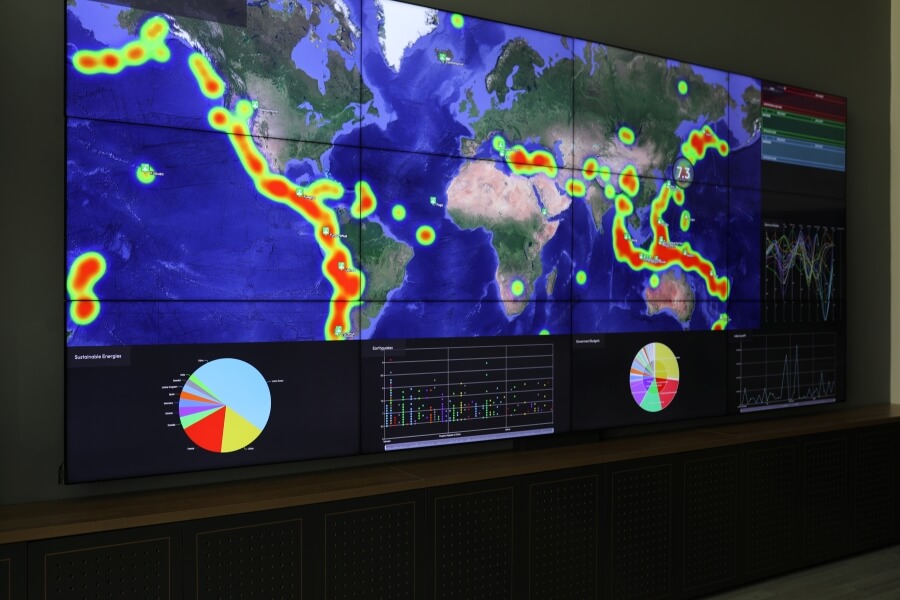
- Configure Layers: Translate these coordinates into interactive Marker Layers or Heatmaps. As new data arrives, these map layers will visually update to reflect asset movements or emerging operational hotspots.
5. Enabling Team Communication via Message Wall
During active incidents, team communication must be visible to everyone. Using the Wall element in the Media Module, you can deploy a central chat interface directly onto the video wall. Operators can join via a secure QR code from their mobile devices and post rich text updates, critical voice notes, and field images that appear instantly on the shared screens.
6. Integrating Live Alert Feeds
To track automated system alerts, use the Messages visualization found within the Media Module. Unlike a standard chat wall, this element is entirely data driven. By connecting an active database or REST API, you can display a scrolling feed of live operational alerts, completely customized with priority tags and location filters.
7. Monitoring CCTV and Live RTSP Streams
Visual confirmation is essential in any control center. The Stream feature allows you to connect secure RTSP camera links. You can deploy multiple live surveillance feeds simultaneously onto your video wall layout, scaling them up or down without consuming local storage space.
8. Preparing for SCADA Integrations
As industrial environments evolve, bringing process engineering to the main display becomes vital. Lygos is actively expanding to support comprehensive SCADA architectures, allowing supervisors to monitor electrical grids, manufacturing lines, and heavy machinery telemetry directly alongside standard data analytics and maps (Under Development).
9. Anticipating Advanced IoT Sensor Data
The future of control room monitoring heavily relies on the Internet of Things. By preparing your layouts for MQTT protocols and advanced sensor connections, you will soon be able to stream localized environmental metrics, equipment temperatures, and facility diagnostics in real time across your operational dashboards as an overlay to architectural floor plans.
10. Constructing Dashboard Layouts
With your charts, maps, and media feeds prepared, return to the Display Module to build your collage. Select your active Screenspace Layout and drag your created assets into the dynamic grid area. You can resize a live map to dominate the center screens while surrounding it with smaller CCTV streams and KPI indicators. Create multiple layouts and switch between them anytime either with hand or by automation.
11. Interacting with the Video Wall Layouts Remotely
Operators must manipulate data without leaving their workstations. Using the Control Module layouts can be controlled, team members can connect via desktop PCs or tablets. They can pan across live tracking maps, zoom into specific data clusters on a chart, or use the mobile air mouse to point out critical alerts during an active briefing.
12. Switching Layouts and Automating Workflows
Different operational phases require different visual context. You can manually swap between preconfigured layouts using the Quick Action Menu to shift from a global overview to a regional incident response view. Additionally, you can utilize Video Wall Automations to schedule layout changes automatically based on shift rotations. Moreover, you can leave assign spots to layouts which can be used to bring on demand visualizations without changing the layout.
Configuring Data Windows
To ensure smooth performance and deep analytical capabilities, you must properly configure the Data Window settings for your active sources. A Data Window defines exactly how many data points the system retains in its memory at any given time. For example, if you establish a real time connection to a REST API, it naturally fetches the current status. However, by configuring the Data Window to retain a larger number of incoming points, the Lygos system actively builds a historical timeline from that live feed. This accumulated history not only prevents memory overload by capping the maximum stored points, but it is also the foundational step that makes animating your live data possible.
Animating Real-Time Data
Once window data is configured you can animate your real-time data. Because your Data Window has safely stored a sequence of historical points from your live feeds, you can seamlessly animate this data across your screens. You can play back the stored data points. The moment your connected databases, file watches, or REST APIs fetch new metrics, your deployed charts and geographic maps update instantly. This continuous, seamless data flow ensures that your video wall always reflects the absolute current state of your operations, keeping your entire control room perfectly synchronized with the live environment.