How to Display GIS Maps on Control Room Video Walls
Control room operators require high resolution geographic information systems for complete situational awareness. Using Lygos visual data analytics software, you can display interactive GIS maps scaling over 100 million pixels across seamlessly synchronized displays.
This comprehensive guide explains how to build, deploy, and manage multi layered spatial visualizations on your video wall environment.
1. Setting Up Your Video Wall Environment
Setup your video wall, before projecting any spatial data, you must define your physical display canvas within the Lygos software. Open the Display Module and create a new Screenspace. This virtual grid groups your distributed screen nodes into a single, unified video wall. Once your screens are assigned to this Screenspace, they will behave as one massive seamless monitor ready for high fidelity geographic rendering.
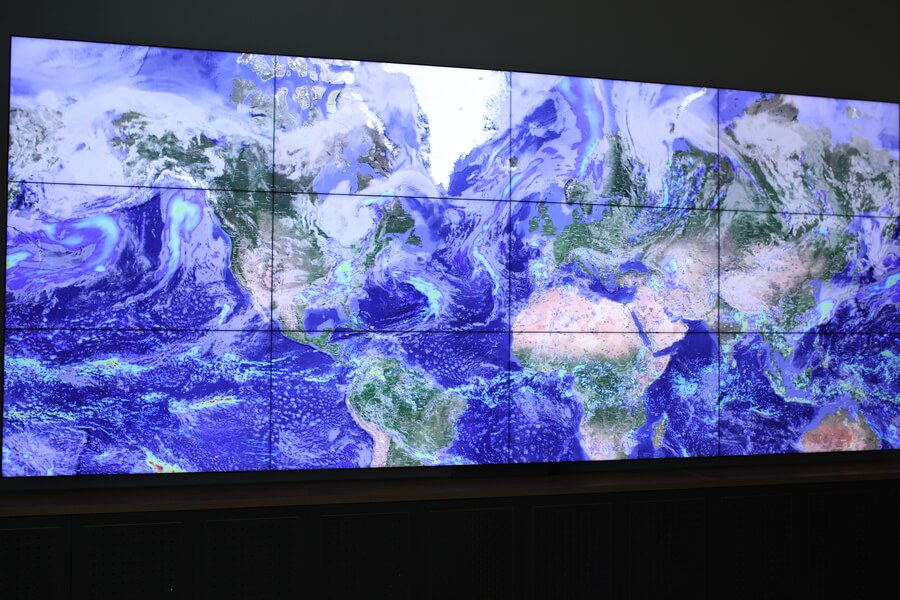
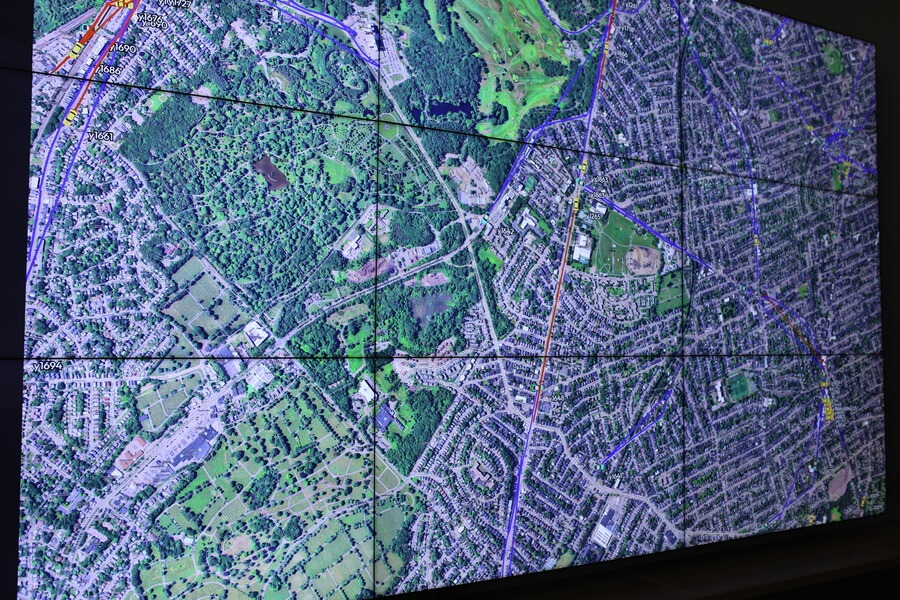
2. Creating Your Base Map
Navigate to the Maps module to build your foundation. Create a new map visualization and select your Base Layer. You can choose from standard geographic tile layers or integrate custom cartography using a specific TileSource, which is ideal for dark mode command centers or specialized topographical views; or for offline, closed circuit and mission critical environments.
3. Loading Spatial Data Sources
Lygos supports massive scale GIS mapping by connecting to diverse spatial data feeds. Through the Data Module, you can integrate information using various methods.
- Importing Files: Use the GeoData editor to manually upload GeoJSON and KML files for boundary mapping, or utilize the Spreadsheet editor for standard CSV and Excel files containing latitude and longitude coordinates.
- Utilizing File Watch: For constantly updating local intelligence, set up FileWatch to monitor specific server files. Any external edits to these files are instantly streamed as live data updates to your maps.
- Connecting REST APIs: Poll remote external services to fetch live tracking telemetry or active incident reports directly into the Lygos spatial engine. Alternatively, create RestAPI access points on Lygos Server through RestService module for external systems to push/dump data to your data sources.
- Streaming from Databases: Connect securely to relational and NoSQL databases like PostgreSQL, MongoDB, or Elasticsearch. Configure continuous background polling to feed massive datasets into your video wall without manual intervention.
4. Defining Format of Data
Use our innovative and easy to use data format user interface to specify which dimensions of your data sources will be made available to your visualizations and what kind of data each dimension has. This will determine which types of map layers can use which data sources. For example, having geographic coordinates enables that data source to be used in marker or icon layers, while having territorial information enables it to be used in choropleth maps.
5. Connecting Data Sources to Your Map
With your spatial data loaded into the system, return to your Map Editor. Open the Data tab and assign your new data sources to the map. By toggling these datasets on, the map engine prepares the coordinates and geographic properties for visual rendering.
6. Deploying the Map Across the Entire Video Wall
To display your geographic intelligence, use Display Module or select the Deploy option directly from the Map Editor. Choose your target Screenspace and assign the map to the first available spot on the Layout grid. By default, the map will scale to fill the assigned layout slot, delivering a sweeping, full wall geographic overview perfectly synchronized across all physical screens.
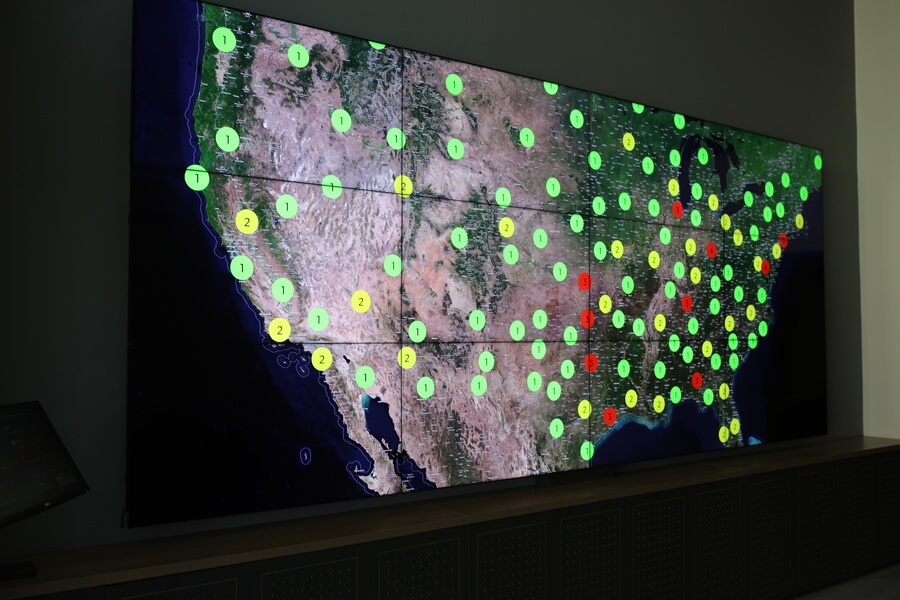
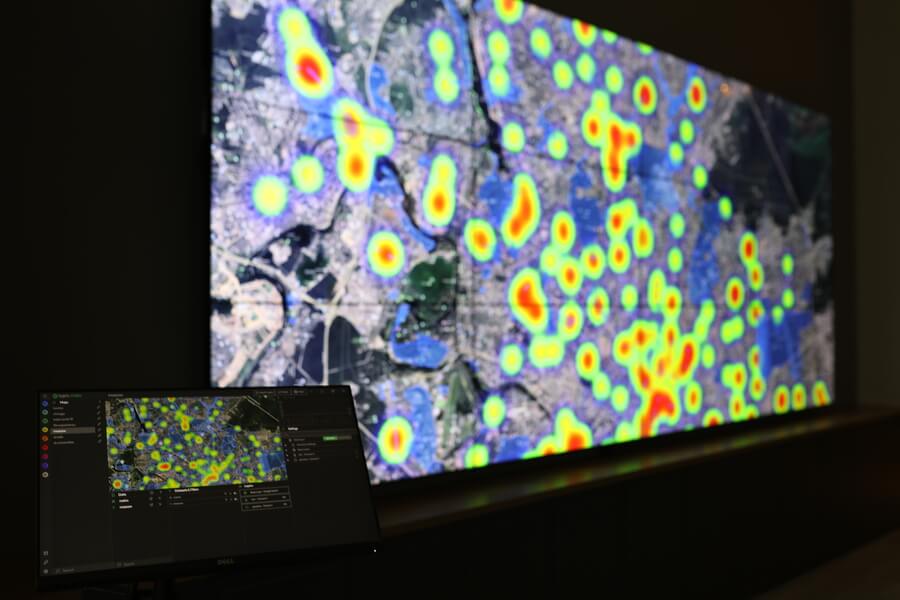
7. Creating Map Layers
Raw data requires visual context. Inside the Maps module, use your connected datasets to generate specific Map Layers. You can convert coordinate data into a Marker Layerto pinpoint asset locations, or apply a Heatmap Layer to visualize the density of reported incidents. These layers bring immediate clarity to complex spatial metrics.
8. Displaying Multiple Maps Side by Side
For comparative analysis, you may want to view two different geographic regions or data sets simultaneously. Create a second map visualization in the Editor. Deploy the new Map to your screenspace layout through Editor Deploy or Display Module. Resize and position maps to fill your layout grid side by side. You now have two fully independent maps deployed evenly across your video wall.
9. Building Multi Layered Map Visualizations
Lygos allows you to stack an unlimited number of analytical layers on a single map. You can combine a GeoJSON boundary layer representing municipal zoning with an active Tracking Layer monitoring live fleet movements. Furthermore, you can apply logical property filters to these datasets to isolate specific data subsets, such as only showing high priority alerts on a dedicated Icon Layer.
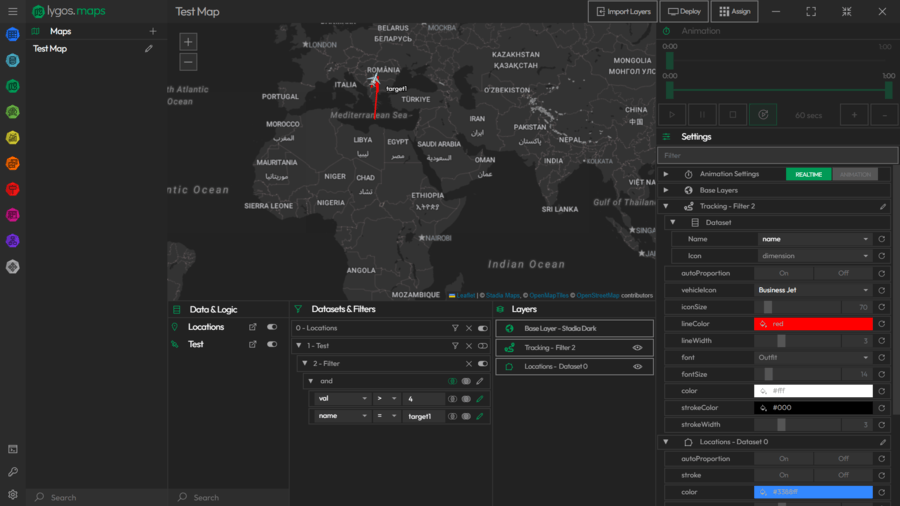
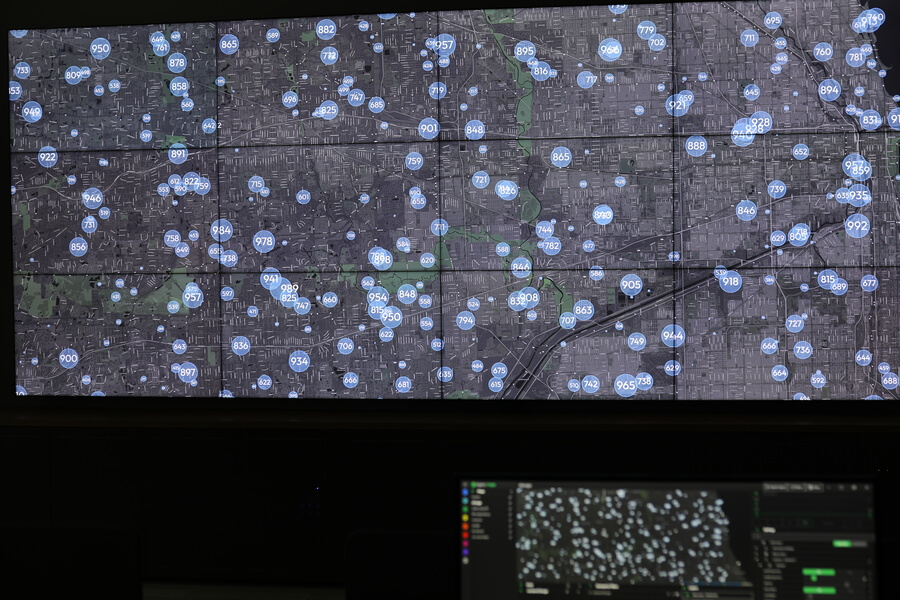
10. Configuring and Styling Your Maps
Optimize your geographic visuals for long distance readability. Open the Settings tab to adjust layer opacity, customize heatmap color gradients, and increase marker border thickness. You can also configure clustering thresholds for dense datasets, ensuring your video wall remains uncluttered and actionable regardless of the zoom level.
11. Integrating Supplementary Data Visualizations
Spatial data often contains valuable numeric metrics. You can feed the exact same database or API source into the Visualization Module to create supporting analytical charts. Build dynamic bar charts, KPI indicators, or time series graphs, and deploy them to adjacent slots on your video wall layout to provide comprehensive context alongside your main GIS map.
12. Real Time Data Updates
Integrate your real-time data by connecting through Data Module. Configure your data window settings and get real-time animated updates on your visualizations on video walls.
13. Animating Time Series Data
Bring your historical data to life using the built in animation controls. If your dataset includes timestamps, you can define a time interval and press play to watch incident trends evolve over time directly on the map. For advanced operations, utilize Temporal Synchronization from the Control Module to lock the playback of your map layers with your supplementary charts, ensuring all visual analytics on the video wall update in perfect harmony.