Forex
The Forex module allows you to track and visualize live financial market data directly within your Lygos environment. Whether you are monitoring global economic shifts on a dedicated trading floor or displaying real-time cryptocurrency and commodity trends across a sprawling video wall, this tool ensures your team always has the latest figures at a glance. Featuring an intuitive search function, flexible grid based card layouts, adjustable timeframes, and fully customizable line or area charts, you can effortlessly design a dynamic financial dashboard tailored to your exact operational needs.
How to configure and display forex on video walls and dashboards
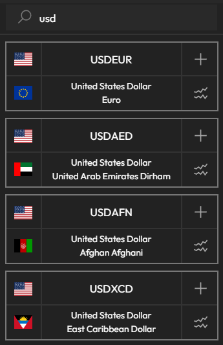
🔍 Getting Started
- Use the Search bar to find and select your desired trading pairs.
- Display your pair as either a Line Chart or Current Price.
🧩 Layout & Cards
- Added pairs appear as cards in the grid area.
- You can place and resize cards based on your screen Layout.
For example, if your layout is 4×4, setting a card to 4×4 in the Forex editor will make it fill the entire screen space.
⏱️ Time Span Selection
Each card allows you to select the timeframe shown:
- Current (Live Price)
- Day
- Week
- Month
Adjust this from the top-left corner of each card.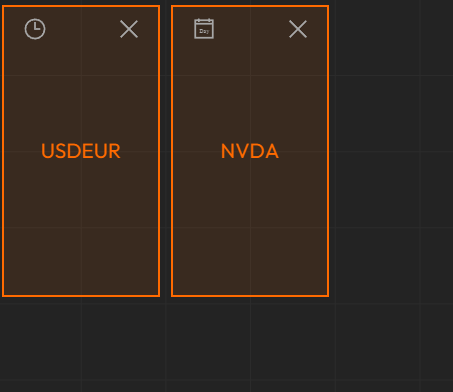
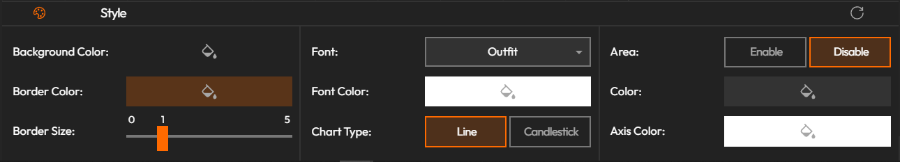
🎨 Style Customization
Personalize your Forex display with the following options:
- Background Color
- Border Color & Size
- Font & Font Color
- Chart Type: Choose between Line or Area chart.
- Area Color: Background color for area charts.
- Axis Color: Color of axis and line strokes in charts.
Deploy on video walls and Dashboards
Deploy through Editor by clicking Deploy. Select a screenspace and select load into first available spot or swap with already deployed visualization.
Deploy through Display Module by navigating Display Module. Select screenspace and layout. Select visualization to deploy and click load or drag and drop into grid area.