Weather
The Weather module allows you to integrate real-time meteorological data and dynamic forecasts directly into your Lygos environment. Whether you are monitoring critical environmental conditions for a global logistics center or displaying live local updates across a massive video wall, this tool keeps your team informed with accurate atmospheric insights. Featuring customizable locations, flexible update intervals, and rich display settings, including animated backgrounds, temperature scales, and granular hourly or weekly views, you can easily tailor the weather widget to suit any operational dashboard.
How to configure and display weather on video walls and dashboards
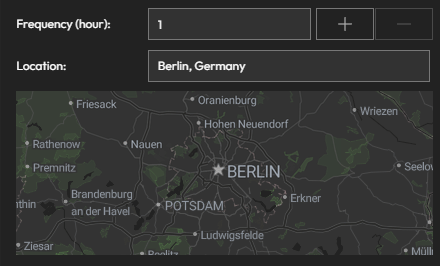
📍 Location
- Enter the location you want to monitor.
- You can change this location at any time.
🔁 Update Frequency
- Set how often the weather data should refresh (e.g., every 15 minutes, hourly).
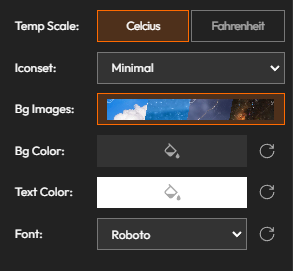
🎨 Display Settings
Customize how your weather forecast looks on screen:
🌡 Temp Scale:
- Choose between Celsius and Fahrenheit
🌤 Icon Set:
- Select different icon styles for weather indicators
🖼 Background Images:
- Toggle animated background visuals (only works when layout size matches or is smaller than the screen)
🎨 Background Color:
- Set a solid background color (used when background images are off)
📝 Text Color & Font:
- Customize font style and text color
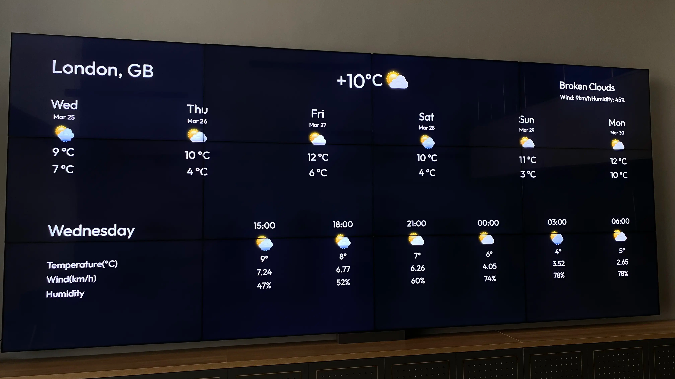
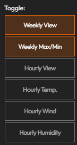
👁️ Visibility Options
Toggle different weather forecast components:
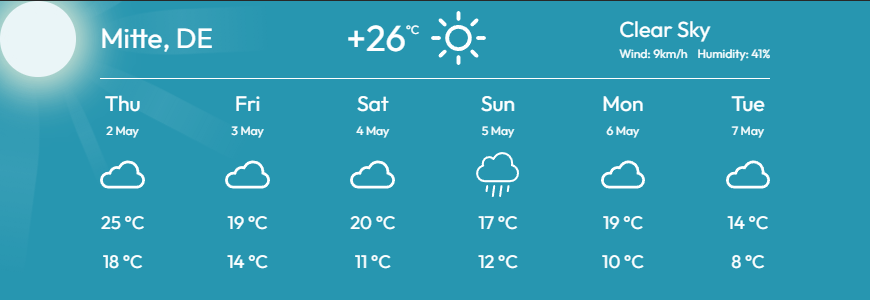
📆 Weekly View:
- Displays forecasts for the next 6 days
🌡 Weekly Min/Max:
- Shows minimum and maximum temperatures when Weekly View is active
⏰ Hourly View:
- Displays forecasts in 3-hour intervals
📊 Hourly Data Toggles:
- Show/hide specific hourly data:
- Temperature
- Wind
- Humidity
Deploy on video walls and Dashboards
Deploy through Editor by clicking Deploy. Select a screenspace and select load into first available spot or swap with already deployed visualization.
Deploy through Display Module by navigating Display Module. Select screenspace and layout. Select visualization to deploy and click load or drag and drop into grid area.