Diagrams
The Diagrams module provides a powerful, built in workspace to create, customize, and deploy visual schematics directly within the Lygos environment. Whether you need to map out complex network topologies for an operation center or display essential operational flowcharts across a massive video wall, this intuitive drag and drop tool eliminates the need for external diagramming software. With comprehensive shape libraries, context sensitive formatting controls, and high-quality export options, you can instantly build and present clear, professional diagrams on any screen. These diagrams can be deployed to any section of video walls and alongside any content and ideal for video wall wide presentations.
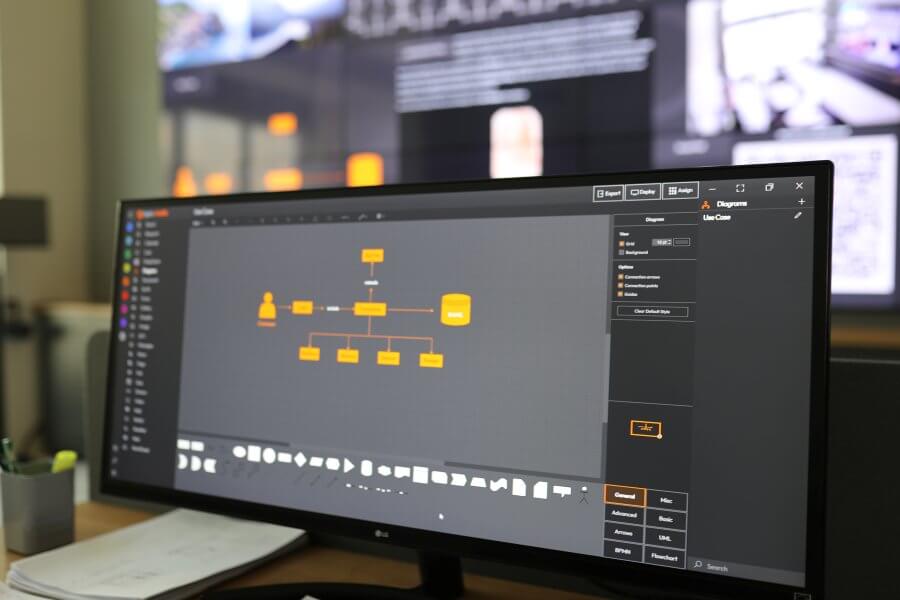
How to configure and display diagrams on video walls and dashboards
🧱 Insert Shapes
- Shapes are grouped in Shape Libraries (e.g., basic, flowchart, network).
- Expand/Collapse libraries by clicking their name.
- To add a shape:
- Click to insert, or
- Drag and drop the shape onto the canvas.
🎛️ Format Panel
Located on the right side, the Format Panel is context-sensitive, meaning it adapts based on what is selected:
- Style shapes: Fill color, border, shadows, etc.
- Connectors: Line types, arrows, routing options.
- Text: Font, size, alignment.
- Layout: Position, size, rotation, layering.
📤 Export Options
Export your diagram when finished:
- PNG – for use as images in reports or presentations.
- SVG – for scalable and editable vector graphics.
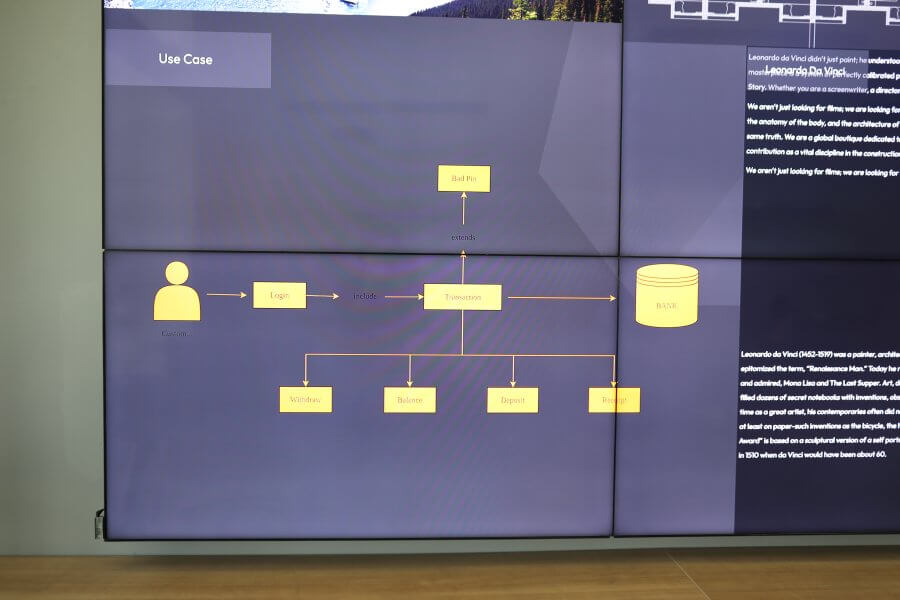
Deploy on video walls and Dashboards
Deploy through Editor by clicking Deploy. Select a screenspace and select load into first available spot or swap with already deployed visualization.
Deploy through Display Module by navigating Display Module. Select screenspace and layout. Select visualization to deploy and click load or drag and drop into grid area.