Poll
The Poll module enables you to create interactive surveys and gather real-time audience feedback directly within your Lygos environment. Whether you are collecting critical team input during an operation center briefing or broadcasting live, animated voting results across a massive video wall, this tool seamlessly connects your displays with users mobile devices via QR code. Featuring robust security options like one time voting tokens, customizable visual styles, and dynamic live result visualizations including treemaps, grids, and pie charts you can securely capture and present data driven insights in a highly engaging format. It is ideal for creating company or organization polls where employees join with QR codes and live results are displayed on video wall screens.
How to create and display poll on video walls and dashboards
🛠️ Poll Editor
- Enter your poll question.
- Add up to 8 options.
- Optionally, upload an image to visually support your poll.
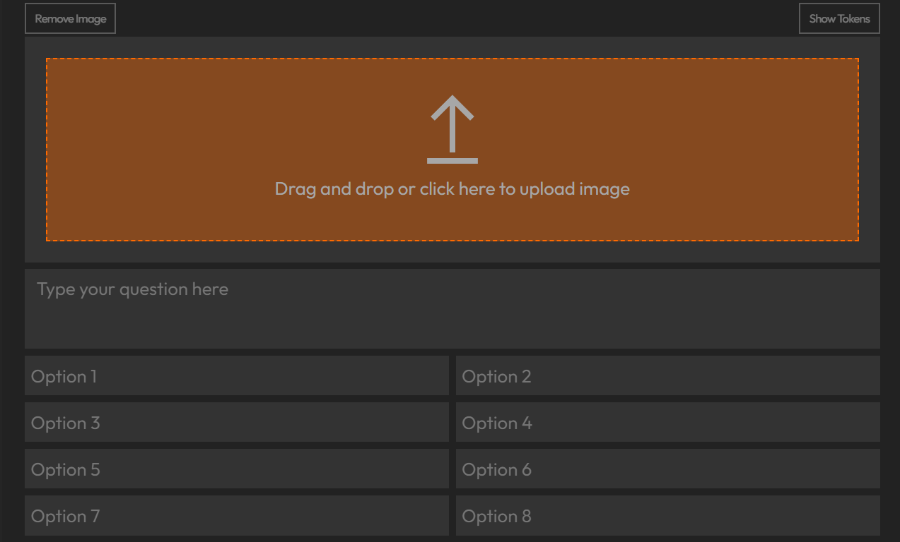
🎨 Style Customization
- Background Color: Set background for deployed screens.
- Font Color: Adjust text color for better visibility.
- Font: Choose a font style for the poll.
🔐 Settings
- Voting Security:
- Session:
- Allows one vote per browser session. Voters might manipulate it.
- Token:
- Voters must use a one-time token.
- Click Show Tokens in the editor to generate, copy and distribute them.
- Session:
- Multiple Selection:
- Enable to allow voters to select more than one option.
- Mode:
- Per Layout:
- Controls in Editor are disabled.
- Same Poll Visualizations on different Screenspace Layouts will be controlled seperatly.
- Everywhere:
- Poll behavior is synced across all Screenspace Layouts.
- Controlled only from Editor.
- Per Layout:
🎛️ Poll Controls
- Show QR: Display a QR code that users scan to access the poll via their devices.
- Default view when a poll is deployed.
- Result: Show selected result type with live updates.
- QR and Result: Show both QR and live results together.
📈 Result Types
Choose from animated visualizations to display live poll results:
- Ranking
- Grid
- Treemap
- Pie Chart

Deploy on video walls and Dashboards
Deploy through Editor by clicking Deploy. Select a screenspace and select load into first available spot or swap with already deployed visualization.
Deploy through Display Module by navigating Display Module. Select screenspace and layout. Select visualization to deploy and click load or drag and drop into grid area.